Mixed-mode rendering combines SVG and Canvas layers so each portion of a visualization uses the technology best suited to its rendering and performance needs. section 15.3
A practical implementation separates the visualization into layered responsibilities:
- Keep axes and lower-volume chart elements in SVG, preserving responsive and interactive structure. section 15.3
- Place a Canvas element above the SVG for numerous marks such as painting circles. section 15.3
- Plan interaction separately because Canvas drawings do not become accessible DOM elements. section 15.5
Van Gogh small multiples
A Van Gogh visualization keeps radial area and bar charts in SVG while Canvas renders more than 1,000 painting circles, reducing pressure from the SVG and force-layout workload. section 15.3
Figure 15.11 Adopting the mixed-mode rendering approach, we use an SVG container to display the axes, drawings, and letters, and we add a canvas element on top that renders the painting circles.
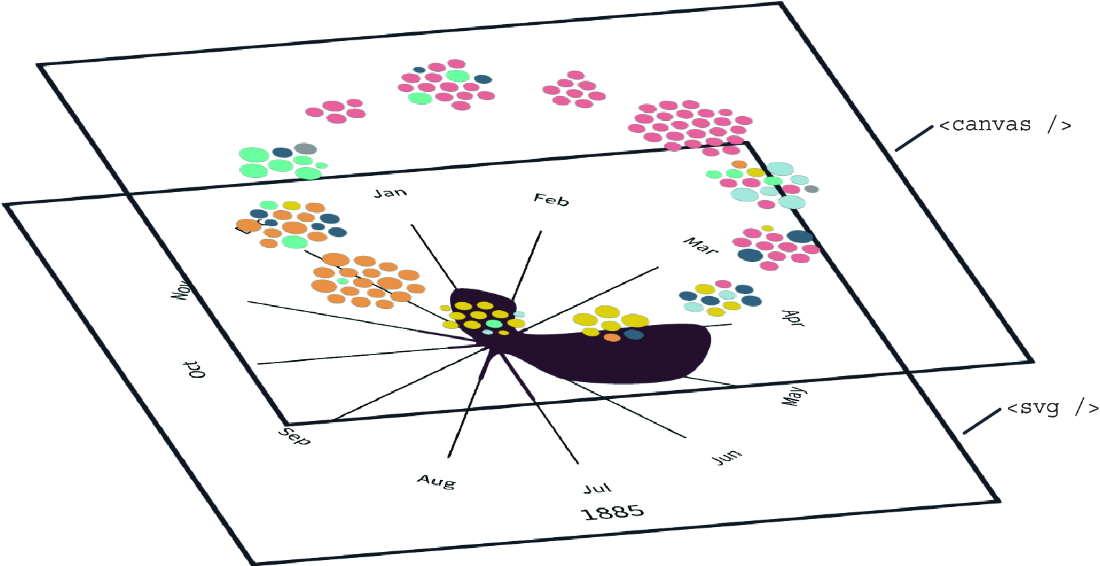
The layered figure makes the division of responsibilities visible: SVG displays axes and chart elements, while Canvas overlays the painting circles. section 15.3
