A model complexity graph relates model complexity to predictive error. It helps diagnose underfitting and overfitting and choose a model that balances both. section 4.0
Read the graph by comparing training and validation errors:
- Plot model complexity on the horizontal axis and error on the vertical axis. section 4.6
- At low complexity, large training and validation errors indicate underfitting. section 4.6
- As complexity increases, training error generally decreases because the model fits the training data more closely. section 4.6
- When validation error decreases and then rises, the upward portion indicates overfitting. section 4.6
- Choose the complexity near the lowest validation error—the middle ground where neither underfitting nor overfitting dominates. section 4.6
Polynomial regression
Suppose polynomial degrees from 0 through 10 are compared. The training error falls as degree increases, while validation error first falls and then rises. If validation error is smallest at degree 4, select the degree-4 polynomial for this dataset. section 4.6
Figure 4.5 The model complexity graph is an effective tool to help us determine the ideal complexity of a model to avoid underfitting and overfitting. In this model complexity graph, the horizontal axis represents the degree of several polynomial regression models, from 0 to 10 (i.e., the complexity of the model). The vertical axis represents the error, which in this case is given by the mean absolute error. Notice that the training error starts large and decreases as we move to the right. This is because the more complex our model is, the better it can fit the training data. The validation error, however, starts large, then decreases, and then increases again—very simple models can’t fit our data well (they underfit), whereas very complex models fit our training data but not our validation data because they overfit. A happy point in the middle is where our model neither underfits or overfits, and we can find it using the model complexity graph.
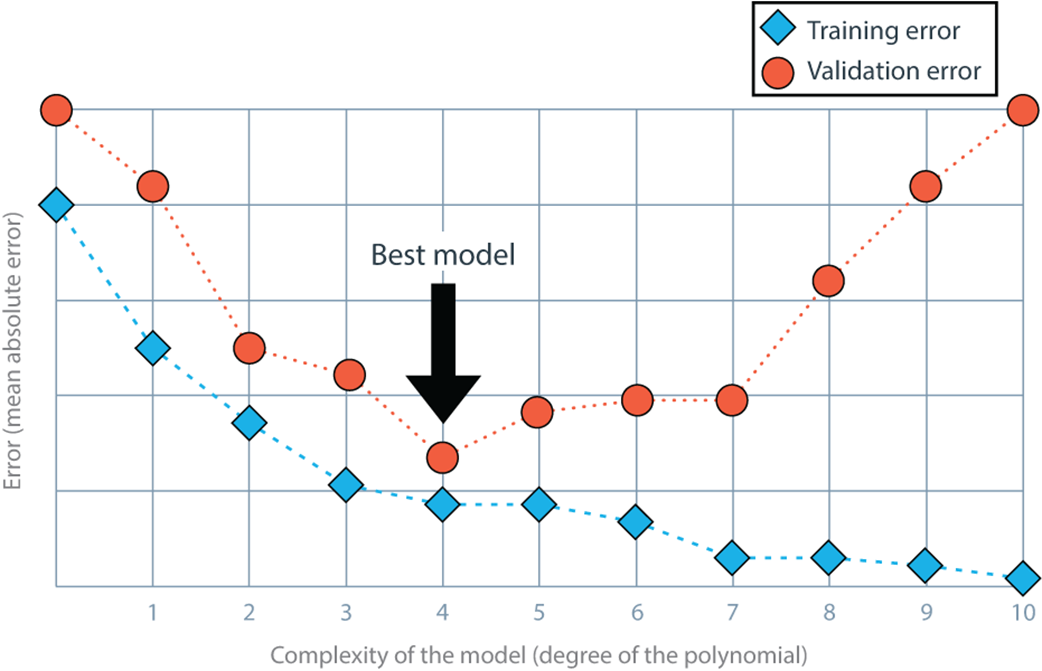
Use the figure to see the descending training-error curve, the U-shaped validation-error curve, and the sweet spot between underfitting and overfitting. section 4.6
