A monitoring stack combines components that collect, analyze, visualize, and alert on operational measurements. For ScyllaDB, Prometheus ingests node metrics, Grafana displays dashboards, and Alertmanager sends notifications when configured thresholds are crossed. section 11.1 section 11.4
Figure 11.1 Prometheus pulls metrics from your database nodes, which are used by the downstream components to provide visualizations and alert notifications.
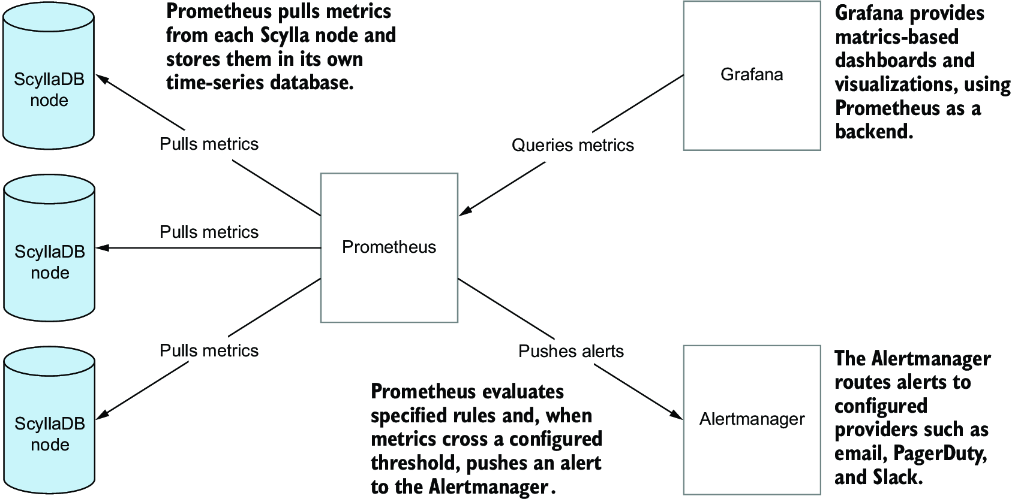
Prometheus pulls metrics from database nodes; downstream components use those metrics for dashboards and alert notifications. section 11.1
A practical monitoring stack provides:
- Prometheus targets configured database hosts, scrapes their metrics endpoints, and supports filtering, transformation, and aggregation with PromQL. section 11.1.1 section 11.4
- Grafana reads Prometheus data to provide dashboards, visualizations, and preconfigured performance views. section 11.1 section 11.4
- Alertmanager receives alerts, routes and filters them with labels, and includes diagnostic details through annotations. section 11.4
- Production monitoring can extend beyond metrics with log aggregation and application traces that correlate activity across nodes. section 11.4
Deploying a Scylla monitoring stack
Download and unpack the monitoring files, configure Prometheus with the scylla-reviews hosts, generate Prometheus and Grafana configuration, create dashboards for Scylla 5.4, and run the three containers with docker compose up --detach. The resulting containers provide alerting, dashboards, and metric ingestion. section 11.1.1
