liveBook · Manning

Multidimensional metric

As explained in Quarkus in Action

A multidimensional metric is a metric represented by separate data series for combinations of labeled dimensions.

A multidimensional metric stores separate data series for combinations of labeled dimensions, such as JVM memory usage separated by memory pool. Grafana can expose each tag combination as its own series when querying Prometheus. section 10.3.6

JVM memory by memory pool

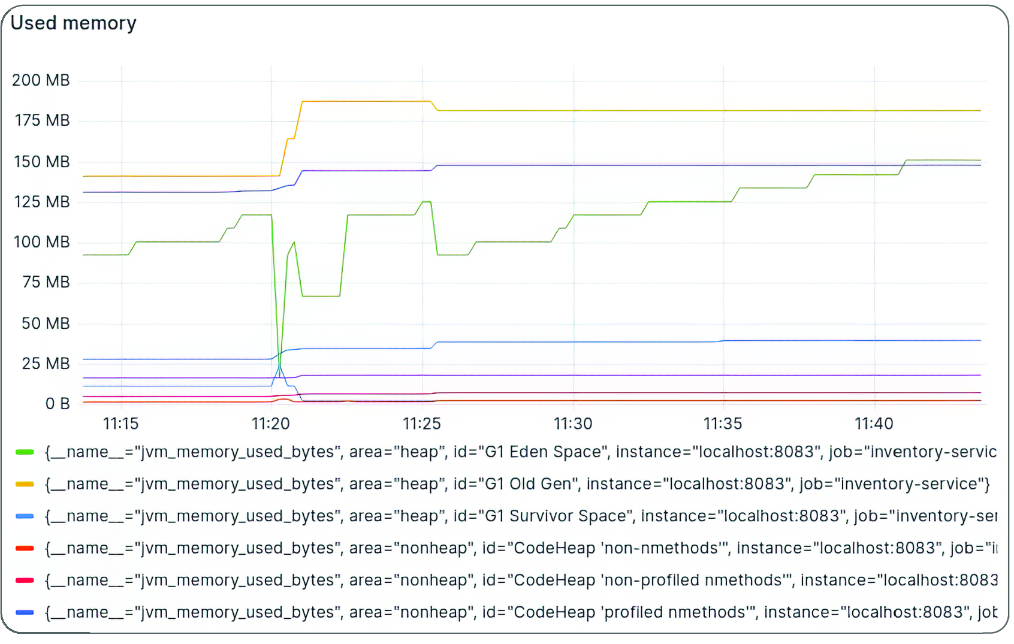
The jvm_memory_used_bytes metric can show used memory independently for Eden space, Old Gen, Survivor space, and other JVM pools. A Grafana time-series visualization can display these series together and convert values to a convenient unit such as bytes (SI). section 10.3.6

Figure 10.7 Visualizing JVM memory usage in Grafana
figure

Use the JVM memory visualization to inspect how a multidimensional metric becomes multiple time series in Grafana. section 10.3.6

How Quarkus in Action covers it

How deep it goes
Defines tag-based series and demonstrates visualization, but does not detail metric storage or query syntax.
Examples
Uses jvm_memory_used_bytes to chart memory separately for Eden space, Old Gen, Survivor space, and other pools.
What it assumes
Assumes access to application metrics, Prometheus, and Grafana for querying and visualization.
What you can do after
Evaluate dimensional metric behavior by creating a Grafana time-series visualization.
How it connects
Connects metrics with dimensions, tags, Prometheus, Grafana, and JVM memory usage.

Related concepts

This explainer was generated by Manning's knowledge graph from the text of Quarkus in Action. The section links point to the parts of the book it draws on.