Muri is production overburden: demand exceeds a system’s capacity, even briefly. The risk is not just high average load; it is too little headroom to absorb variation, which can turn a surge into cascading timeouts and failures. section 12.5.2
Use these distinctions when assessing production load:
- Mura is uneven demand; it creates surges. Muri is the overburden those surges cause, while Muda is capacity left idle during lulls. section 12.5
- Steady-state utilization can hide muri: a service at 81% RAM may need 121% capacity during a 30% increase, triggering latency spikes and failures. section 12.5.2
- For critical services, one Lean heuristic is to target 60–80% utilization, preserving headroom for variation rather than optimizing for steady-state efficiency alone. section 12.5.2
A surge hidden by averages
An analytics service sized for average upload demand hits memory limits during a morning spike: queues grow, latency rises, and jobs time out. After the spike, utilization falls to 15%. The peak reveals muri; the later idle capacity reflects muda. section 12.5.1
Figure 12.10 Headroom determines whether a traffic surge is absorbed or becomes a cascade.
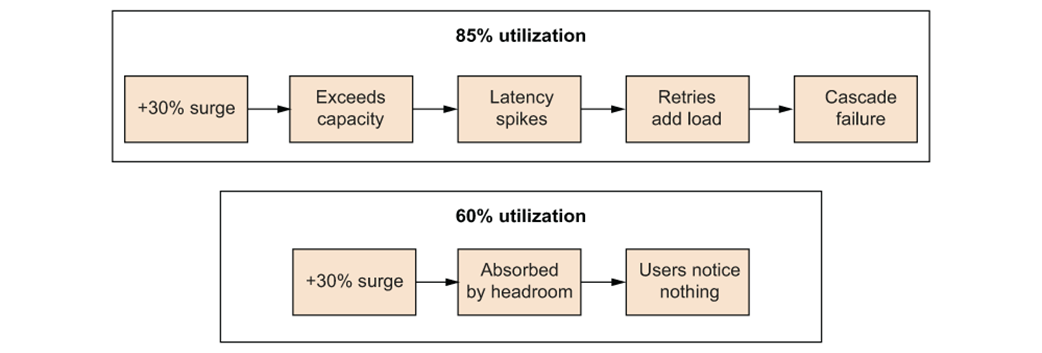
Use the figure to see how available headroom determines whether a traffic surge is absorbed or becomes a cascade. section 12.5.2
