A nearest neighbor graph turns vectorized data points into a similarity network. Each point connects to selected points with the most similar representations, enabling unsupervised grouping without fixing the number of clusters in advance. section 8.0 section 8.5
A practical construction workflow is:
- Extract interpretable features manually and represent every data point as a vector. section 8.0
- Inspect feature distributions and correlations before measuring similarity. section 8.2
- Compare vectors with cosine similarity, using an efficient similarity search rather than comparing every pair when necessary. section 8.2 section 8.5
- Tune the k-nearest-neighbor algorithm's topK and similarityCutoff values, then apply community detection to the resulting graph. section 8.3
- Evaluate communities with aggregate feature statistics and optionally use PageRank to identify representative nodes. section 8.3 section 8.5
Twitter user segmentation
For a Twitter network, manually extracted features such as tweet counts, retweet behavior, timing, degree, graphlets, betweenness, and closeness can become user vectors. A cosine-similarity k-nearest-neighbor graph supports Louvain segmentation; aggregate queries then compare community size and average feature values. section 8.3
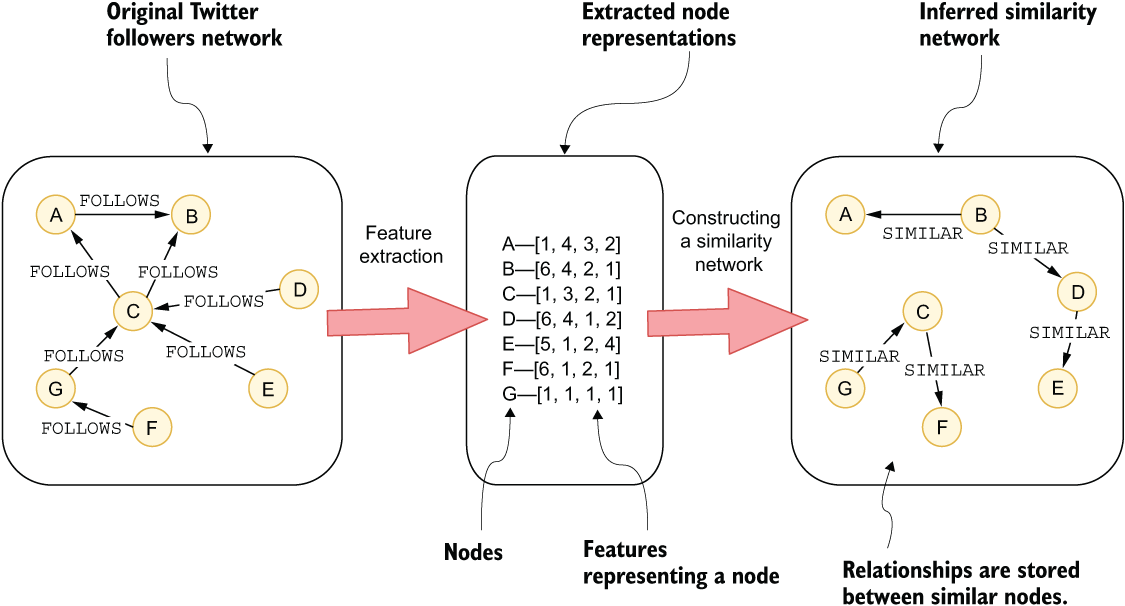
Trace the pipeline from extracting node representations to constructing the similarity network. section 8.0
