A network panel is a browser developer-tool interface for inspecting every resource a page requests. It shows file sizes, download durations, request order, and a waterfall that makes loading sequences visible. It helps evaluate the gap between fast development conditions and users on slower connections or older devices. section 7.1 section 7.1.1
Use the network panel to investigate loading performance systematically:
- Open it while developing features that load data or render content, then reload the page to capture its requests. section 7.1.1
- Enable a throttling preset such as Slow 4G with caching disabled to approximate a first-time visitor on a poor mobile connection. section 7.1.1
- Read the waterfall for request sequence and duration, then sort by size to expose the largest contributors to page weight. section 7.1.1
- Compare transfer size with resource size: transfer size reflects compressed network traffic, while resource size reflects what the browser parses and executes. section 7.1.1
News article template under Slow 4G
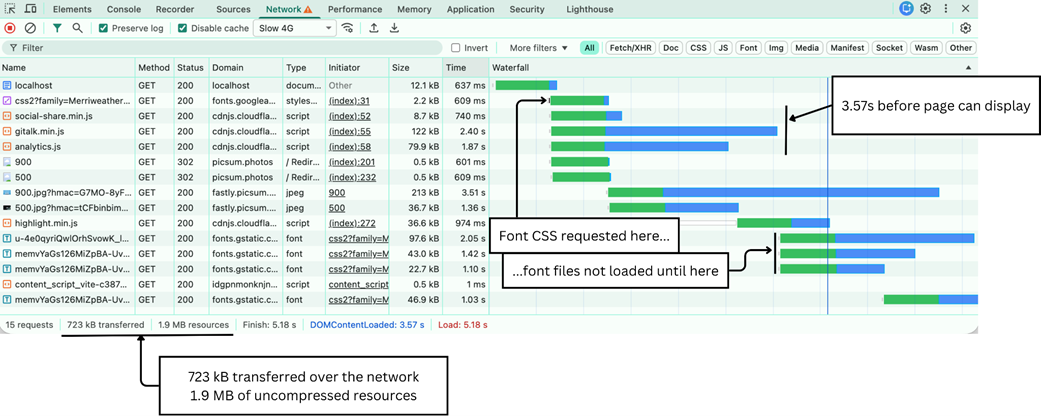
A news template loads a hero image, social widgets, and below-the-fold comments. Fast WiFi makes it appear to load in under a second, but Slow 4G with caching disabled reveals 723 kB transferred and 1.9 MB of uncompressed resources against a 500 kB page-weight budget. Sorting the waterfall exposes three synchronous head scripts—a sharing library, comment widget, and analytics package—that total about 210 kB and delay rendering. section 7.1.1
Table 7.1 Web profiling concerns, tools, and diagnostic patterns
|
Concern
|
Primary tool
|
What to look for
|
|
Loading performance
|
Network panel
|
Large bundles (over 200KB compressed), long dependency
chains, render-blocking resources, and missing cache headers
|
|
Runtime behavior
|
Performance panel
|
Long tasks (over 50ms), layout thrashing, expensive
paints, and poor Core Web Vitals scores
|
|
Memory stability
|
Memory panel
|
Growing heap size across navigations, detached DOM nodes,
and event listeners that accumulate
|
Maps loading performance to the network panel and identifies large bundles, dependency chains, render-blocking resources, and missing cache headers as diagnostic patterns. section 7.1
Figure 7.2 A network waterfall under Slow 4G throttling. Three synchronous scripts block rendering for over two seconds. The font dependency chain shows how font files cannot begin loading until the CSS that references them has downloaded. The bottom bar reveals the gap between transfer size (723 kB compressed) and resource size (1.9 MB uncompressed).
Visualizes the throttled waterfall, synchronous rendering blocks, font dependency chain, and compressed-versus-uncompressed page-size gap. section 7.1.1
