An observed count is the number of cases actually recorded in a category. It may also be expressed as that category’s proportion of the collected data, then compared with an expected frequency. section 5.2.3
Use observed counts to:
- Compare one categorical variable with expected frequencies using a goodness-of-fit test. section 5.2.3
- Arrange counts for two categorical variables in a contingency table and test their independence. section 5.2.3
- Identify disproportionality by examining differences between observed and expected values. section 5.2.3
Feature engagement by country
A product analysis counts users who engaged with a feature, broken out by country and experiment group. Comparing these observed counts with expected counts produces a chi-square statistic and highlights cells where engagement differs from expectation. section 5.2.3
Figure 5.11 Comparisons of two categorical variables can be presented as a contingency table, pivoting the results into summarized rows and columns you can easily view.
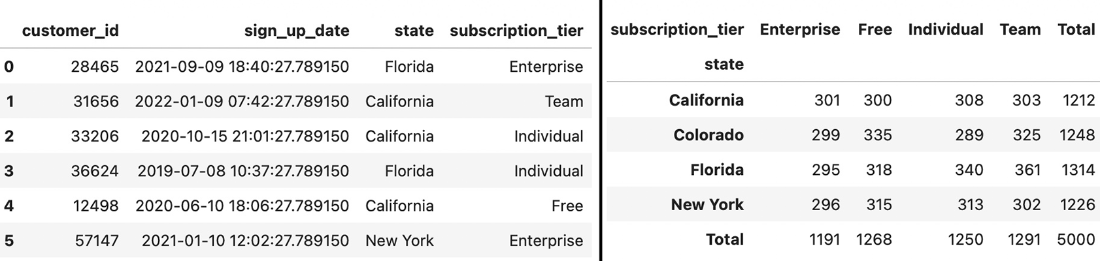
Use the contingency table to inspect observed counts across categorical rows and columns before comparing them with expectations. section 5.2.3
