liveBook · Manning

Ordinary least squares

As explained in Grokking AI Algorithms, Second Edition

The least-squares method fits a model by minimizing the sum of squared differences between observed and predicted values.

Ordinary least squares fits a straight line by minimizing the overall squared differences between observed and predicted values. The line passes through the intersection of the mean feature value and mean target value. section 8.11

Build the regression line in a few practical steps:

  • Calculate the means of x and y. section 8.11
  • Measure each x and y value’s distance from its mean. section 8.11
  • Square the x deviations and multiply paired x and y deviations. section 8.11
  • Divide the cross-product sum by the squared-x sum to find the slope, then calculate the intercept. section 8.11

Predicting diamond prices

For carat and price data, the means are 1,229 and $3,431. After calculating deviations and sums, the slope is about 3.25. Use y = c + mx to draw the fitted line and predict prices for selected carat values. section 8.11

Figure 8.10 Intuition of regression lines
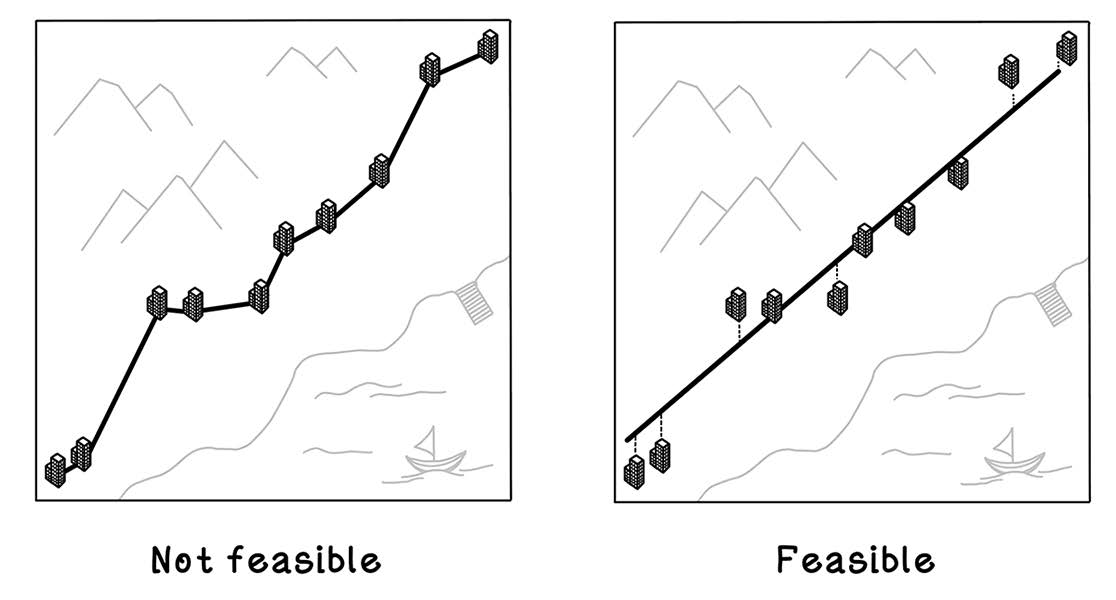
08_10

Use the subway-route analogy to see how one straight line can minimize the total distance to many scattered points. section 8.11

How Grokking AI Algorithms, Second Edition covers it

How deep it goes
Explains means, deviations, slope, intercept, and implementation steps, without pursuing theoretical proofs.
Examples
Uses carat-and-price data, scatter plots, a subway-route analogy, tabulated calculations, and Python-like pseudocode.
What it assumes
Assumes basic averages and line equations while teaching regression calculations from their arithmetic foundations.
What you can do after
Builds a regression line manually or with a short function that returns its intercept, slope, and endpoints.
How it connects
Connects regression lines with linear regression, means, slope, intercept, dependent variables, and independent variables.

Also explained in

Compare how 4 books explain ordinary least squares →

Related concepts

This explainer was generated by Manning's knowledge graph from the text of Grokking AI Algorithms, Second Edition. The section links point to the parts of the book it draws on.

