An order of magnitude measures numerical scale, usually as a power of 10. A tenfold increase represents an increase of approximately one order of magnitude. section 12.2
Orders of magnitude make values spanning wide ranges easier to represent on logarithmic scales, where equal intervals correspond to constant multiplication factors rather than constant differences. section 12.1
Use orders of magnitude to recognize whether numeric data has the scale variation associated with Benford-like behavior:
- Check whether observations extend across several powers of 10 rather than occupying a narrowly constrained range. section 12.2
- Distinguish naturally varying measurements from identifiers or values bounded by arbitrary minimums and maximums. section 12.2
Logarithmic spacing
The intervals from 10 to 100 and from 100 to 1,000 are equal on a logarithmic scale because each spans a tenfold change. In Benford's distribution, leading digit 1 has probability 0.301, while leading digit 9 has probability 0.046. section 12.1
Figure 12.1 A numeric data series perfectly follows a Benford distribution when the leading digits, plotted along the x axis, each have a likelihood of occurrence equal to the probability plotted along the y axis. So, for instance, the numeral 1 should be the leading, or first, digit in approximately 30% of the observations, and the numeral 9 should be the leading digit in fewer than 5% of the observations.
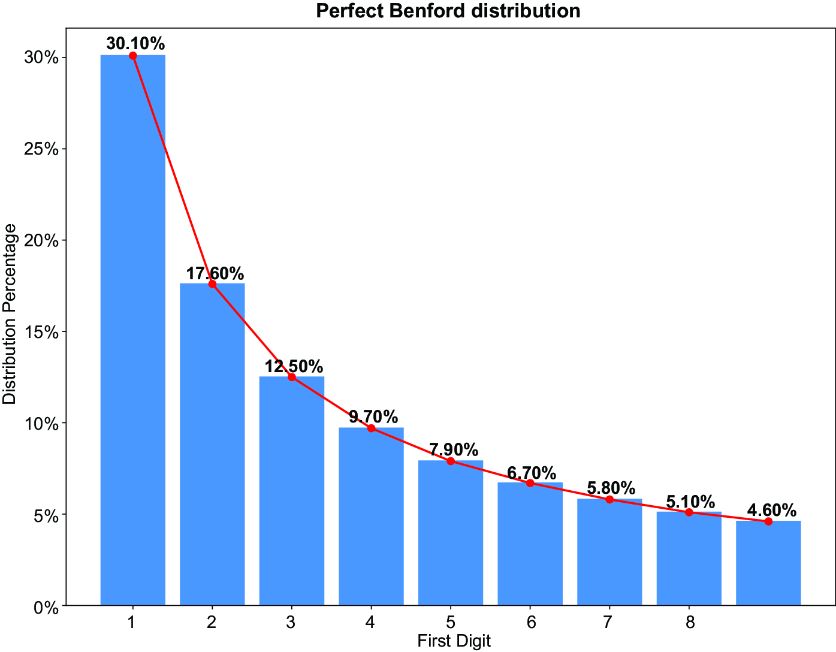
Use the figure to compare leading-digit frequencies and see how a Benford distribution represents values across orders of magnitude. section 12.1
