An organizational strategy metric is a quantitative measure of a specific factor relevant to organizational performance and strategic decision-making. It goes deeper than a broad performance metric by helping teams examine actions and conditions that correlate with or may predict performance. section 7.1 section 7.1.2
Use organizational strategy metrics to examine several operational and external areas:
- Customer metrics track behaviors, experiences, sentiments, engagement, referrals, and customer effort. section 7.1.2
- Product metrics track usage, feature adoption, and workflow completion to inform product development. section 7.1.2
- Market metrics describe external supply, demand, and price conditions that can inform customer acquisition, pricing, and advertising. section 7.1.2
Define each metric specifically, measurably, realistically, relevantly, and within an appropriate timeframe using the SMART framework. Establish a baseline with internal history, external benchmarks, and initial targets, then represent the measure over time and examine its relationship with performance. Treat correlation as a basis for investigation and action, not automatic proof of causation; poor definitions or cumulative measures can create misleading impressions. section 7.4 section 7.1.2
Figure 7.5 Visually representing strong relationships between strategy and performance metrics can help your stakeholders understand long-term trends and whether the relationship strengthens or weakens over time.
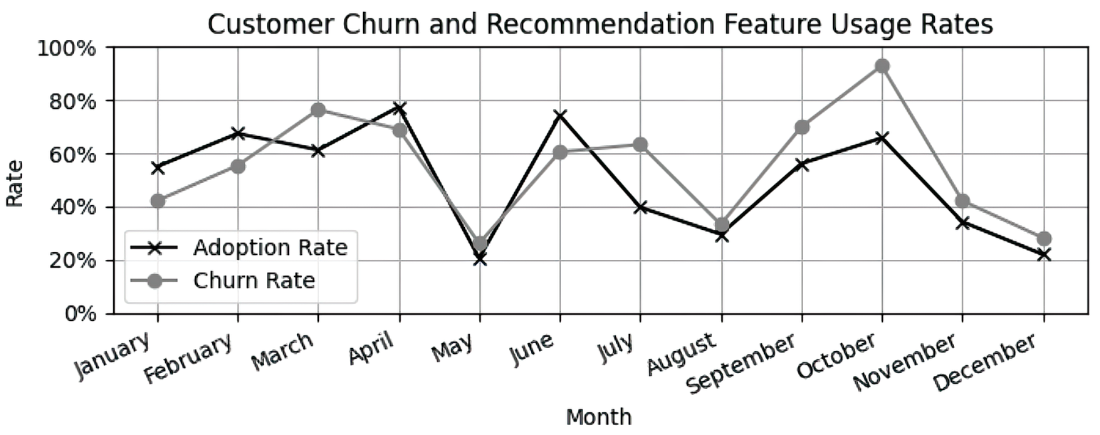
Use the visual comparison to communicate how a strategy metric relates to a performance metric and whether that relationship changes over time. section 7.1.2
