OTLP is the OpenTelemetry Protocol: a vendor-neutral way to structure, encode, and transmit telemetry. It carries logs, metrics, and traces between instrumented applications, collectors, and analysis services. Its purpose is interoperability: a component that produces compliant telemetry can send it to another compliant component rather than relying on a custom integration. section 1.3.2 section 3.1
OTLP is more than a wire destination. It establishes common signal structures so collectors can receive distinct logs, traces, and metrics, transform or associate them, and forward them to downstream OpenTelemetry services or specialist analysis tools. Fluent Bit can occupy either side of that flow: receive OTLP as a collector or export normalized events onward. section 3.6.7 section 5.10
Choose an OTLP transport according to peer capability:
- Prefer gRPC over HTTP/2 with compact Protobuf3 payloads when both ends support it. section 1.3.2 section 3.6.7
- Use HTTP/1.1 with Protobuf3 payloads or JSON messages as permitted alternatives when HTTP/2 support is unavailable. section 3.6.7
- Check version and endpoint support before deployment: signal structures have only recently become stable, and implementations may not support every allowed mechanism. section 3.6.7 section 5.10
Receive separate OTLP signals
An OpenTelemetry input can listen locally on separate ports for logs, traces, and metrics. Configure the traces listener with raw_traces enabled, then send every received record to stdout while validating the pipeline. This makes a small local collector useful for confirming that each signal reaches Fluent Bit in the expected form. section 3.6.7
For containerized applications, sending logs directly from application code or a logging-framework appender to an OTLP-compliant collector avoids an intermediate file or container-management path. Direct routing makes it easier to correlate logs with metrics and traces. OpenTelemetry SDKs support code-level emission, while the Logs Bridge API lets logging frameworks add OTLP-capable appenders. section 4.6.1
Export normalized telemetry
An OpenTelemetry output can send JSON over HTTP(S) to separate logs, traces, and metrics URIs. Set the destination host and port, configure the three signal paths, and repeat add_label to attach shared context such as an application and client label. Enable response-payload logging when an active delivery confirmation is operationally important. section 5.10
Figure 3.8 The phases and separation of steps involved in Open Telemetry traffic
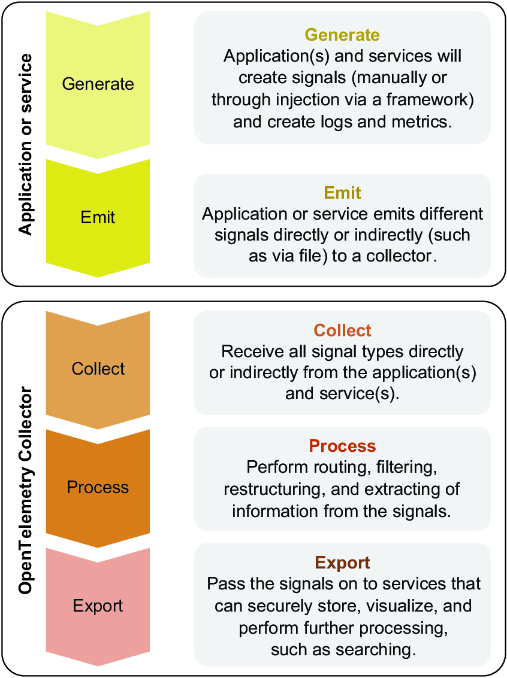
Follow the signal flow through the OpenTelemetry stages to locate where collection, processing, and export occur. section 3.6.7

