Outlier detection identifies items that differ substantially from what is usual in a dataset. An item might be a table row, image, document, or sequence of events. The working assumption is that most items represent normal behavior, but what counts as normal depends on the comparison being made. A flag marks something worth examining, not proof of an error or threat. section 1.0 section 1.4
Unlike a hand-written rule that checks for a known pattern, a detector learns from data to find unusual cases, including cases the rules did not anticipate. Outlier detection commonly works without labels and sits within unsupervised machine learning. Tabular data is a useful starting point; text, images, and time series can also be examined, sometimes by first converting them into tabular features. section 1.2 section 1.3
The comparison and the response depend on the task:
- In payment monitoring, a purchase or sequence may stand out against a cardholder’s history, merchant history, or expected seasonal activity. A flag can direct further fraud investigation. section 1.1.2
- In network security, unusual traffic may expose an unknown intrusion, but excessive traffic could instead come from an unscheduled backup. Finding the deviation precedes identifying its cause. section 1.1.3
- In industrial monitoring, unexpected sensor behavior can prompt inspection or help schedule maintenance, especially when historical failures are too scarce to train a failure predictor. section 1.1.5
- In data-quality checks, unusual records may reveal mistakes without predefined validation rules. Frequent errors can escape detection, while legitimate rare records can be flagged. section 1.1.9
Checking a fund’s assigned segment
Score each fund for how unusual it is relative to its assigned group, then compare its score under alternative groups. A fund less unusual elsewhere may be misclassified under the chosen measure of similarity. The result questions the grouping rather than proving which group is correct. section 1.1.10
Figure 1.1 Temperature readings from sensor data presented as a time series. The x-axis tracks time in seconds and the y-axis tracks the temperature. There is an unusually high level of fluctuation at 200 seconds and an usually low level at 800 seconds.
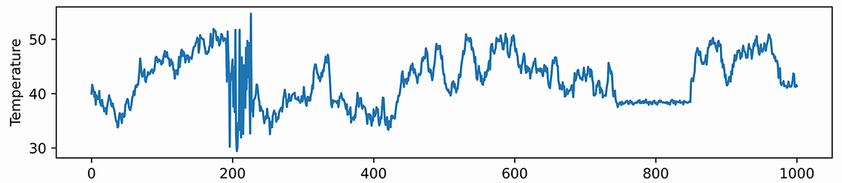
A temperature time series shows both unusually high fluctuation and unusually low fluctuation. Neither is simply an isolated extreme reading; the pattern over time matters. section 1.1.5
Interpret results against the purpose of the analysis. An outlier may be harmless, an error, a warning of failure, or a useful discovery; a group of individually ordinary events may also be unusual together. Different comparison groups can change what stands out, so flagged cases need contextual review. section 1.0 section 1.4

