When a page feels slow, the Performance panel turns execution into an interactive timeline: a flame chart exposes call hierarchy, sampled time, and visible runtime events. Connected through inspection, it profiles a live process; an uploaded .cpuprofile provides the same view offline. section 11.1.6
Use the panel to move from a performance symptom to the responsible execution path:
- Inspect the flame chart to navigate sampled call stacks and locate broad time-consuming regions. section 11.1.6
- Compare self time with total time to distinguish work performed directly by a function from work beneath it. section 11.1.6
- Read the call tree to reconstruct how functions were actually invoked. section 11.1.6
- Treat gaps cautiously: compiler work, shared-library code, and C++ runtime activity may sit outside the JavaScript call stack or be attributed to its triggering function. section 11.1.6
Live versus offline inspection
Connect DevTools to a process started with inspection for an interactive timeline, or upload a .cpuprofile file when the process is no longer running. Browser profiles also include rendering and layout activity alongside JavaScript execution. section 11.1.6
Figure 11.10 The performance profile details panel breaks down self time vs total time for each sampled function.
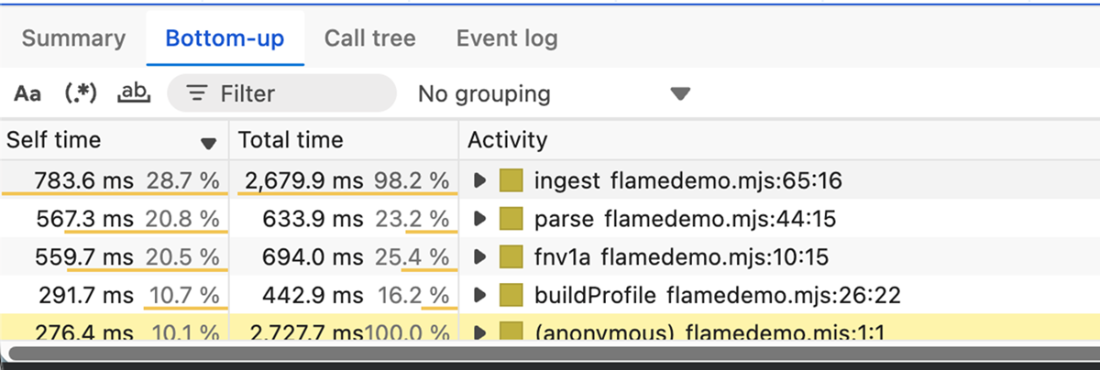
The performance-profile details view makes sampled-function cost concrete by separating self time from total time. section 11.1.6

