Perplexity measures how well a probability model predicts a sequence; lower values indicate better predictive performance. For quantized models, use it to compare end-to-end quality, not as a substitute for weight-reconstruction error or fluency checks. section 8.2.3 section 10.3.4
Comparing quantized variants
On a 1,500-word evaluation slice, IQ4_XS measured PPL 5.36 and Q4_K_M 5.43. The reported standard error was ±0.47, so that run alone cannot establish a reliable difference between the variants. section 10.3.4
Figure 10.5 Wikitext-2 perplexity (4 chunks × 512 tokens, CPU-only) versus on-disk size. F16 (12.85 GB, PPL 5.27) anchors the lossless baseline. F16 → Q8_0 → Q5_K_M is a clean staircase down. Q4_K_M sits to the upper side of Q5_K_M as expected. IQ4_XS sits to the lower-left of Q4_K_M—smaller and lower perplexity at the same bit tier.
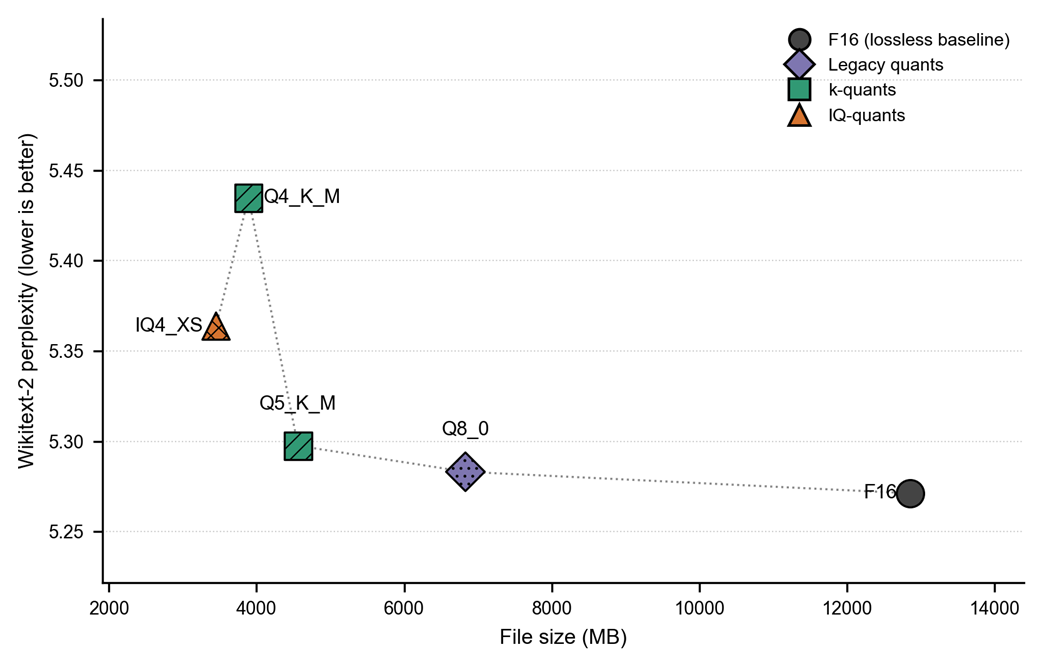
Compare perplexity with model size across quantization variants; F16 provides the baseline, while IQ4_XS is smaller and lower in perplexity than Q4_K_M in this evaluation. section 10.3.4