Long-term PostgreSQL statistics reveal workload trends, capacity needs, and problems that point-in-time monitoring can miss. pg_statviz captures timestamped snapshots inside the database, avoiding the storage, cost, and operational overhead of heavier external monitoring stacks. section 7.5 section 7.8
Use pg_statviz when periodic historical visibility is more valuable than a complex monitoring deployment:
- Schedule periodic snapshots with a job scheduler; a one-minute interval produces relatively little data. section 7.5
- Store snapshots in tables under the pgstatviz schema rather than exporting them to external storage. section 7.5
- Analyze background-writer and checkpointer activity, cache hits, connections, I/O, tuples, locks, wait events, WAL, transactions, and configuration. section 7.5
- Resample large snapshot histories into a chosen number of plot points, with 100 points as the default. section 7.5
A lightweight snapshot workflow
Install the extension with CREATE EXTENSION pg_statviz;, then schedule SELECT pgstatviz.snapshot();. The command records a timestamped snapshot, which can later support workload analysis and visualization without loading a module through shared_preload_libraries or restarting the server. section 7.5
Figure 7.1 pg_statviz locks analysis output. This visualization displays the mean number and type of locks in the database, with snapshots taken every minute over a period of several months in 2024.
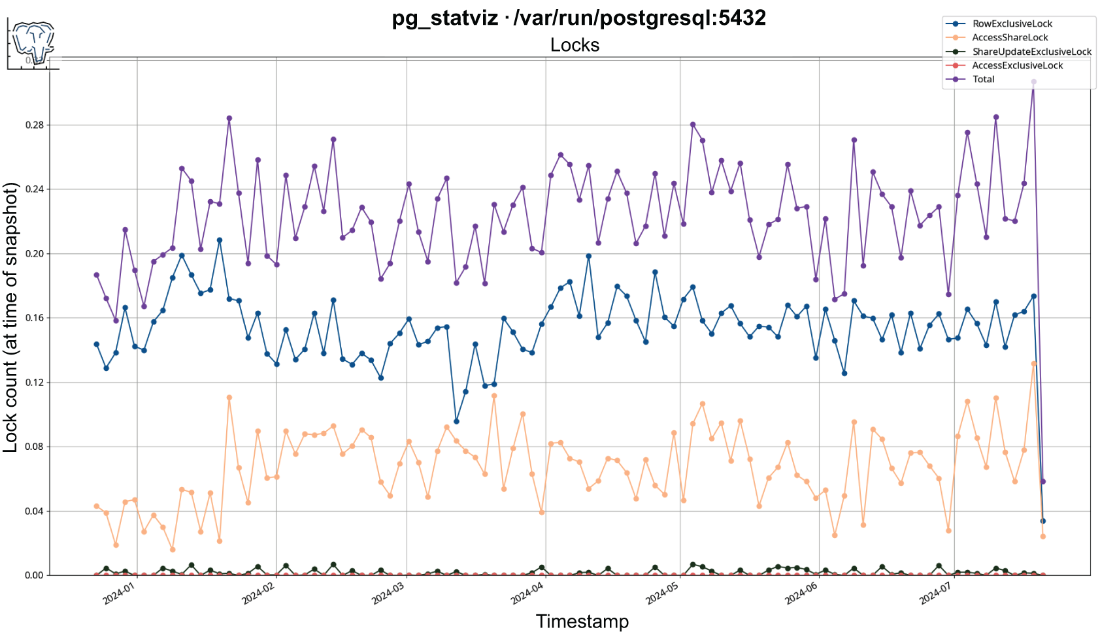
A locks analysis over minute-level snapshots illustrates how pg_statviz turns historical lock measurements into a multi-month visualization. section 7.5
