Policy overlap means that, for the relevant decision contexts, the policy that generated the logs had a positive probability of taking the actions the candidate policy would take. Overlap gives an off-policy evaluation evidence about those actions; without it, estimates become unreliable or depend more heavily on outcome-modeling assumptions. section 5.2.2 section 5.2.1
A recommendation policy changes direction
Suppose an old recommender never showed documentaries to a particular user group, while a candidate policy would recommend them. The logs provide little evidence about how that group would respond. Modeling the outcome is possible, but the estimate becomes more assumption-heavy. section 5.2.2
Inverse propensity weighting uses the candidate policy’s probability of a logged action divided by the logged policy’s probability of that action. If the old policy showed an item 10% of the time and the candidate would show it 30% of the time, the observed outcome gets a weight of 3. Accurate logged probabilities and sufficient overlap are essential for this correction to be reliable. section 5.4.2
Figure 5.2 illustrates a simplified counterfactual evaluation workflow. Logged interaction data is reweighted using an off-policy correction method, such as inverse propensity weighting, to estimate the value of a candidate policy. That estimate is then compared with a baseline policy. The workflow assumes correct logging, sufficient overlap between the logged and candidate policies, and enough contextual information to support meaningful comparison.
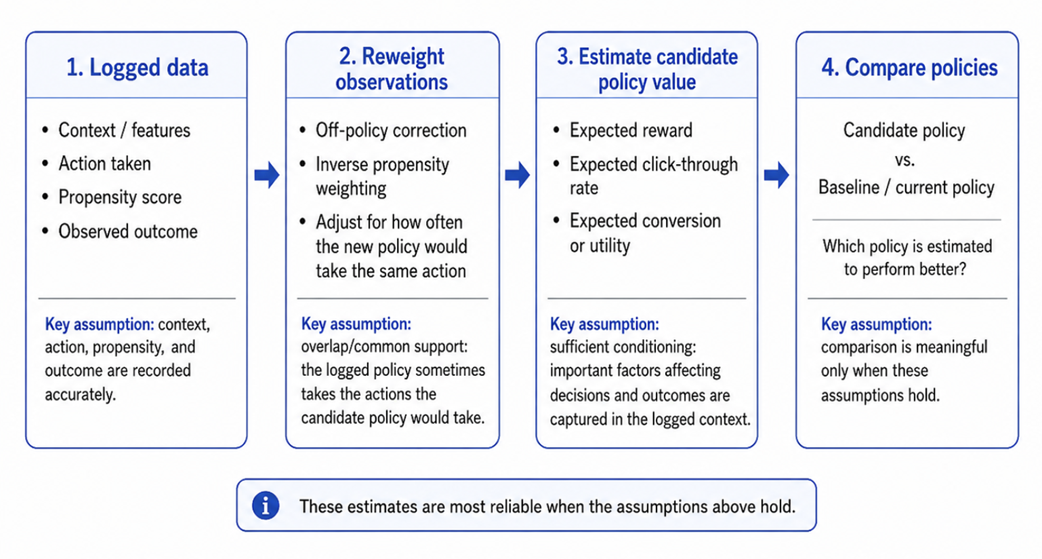
Follow the workflow from logged interactions through reweighting and candidate-policy value estimation to comparison with a baseline. section 5.2.1
Before relying on an estimate, check whether the data supports the candidate policy:
- Inspect exploration and policy differences. Millions of rows can still contain little useful evidence if the old policy rarely tried alternatives or the candidate makes very different decisions. section 5.3 section 5.3.2
- Check effective sample size, confidence intervals and the distribution of importance weights. A small effective sample size relative to the log can warn of insufficient exploration, a large action space or policies that differ too much. section 5.3.2
- Test stability by clipping large weights, removing a small segment or changing the time window. Large swings signal that the estimate may not support a high-confidence decision. section 5.3.2
- Verify propensities and decision-time context. Overlap alone cannot compensate for incorrect action probabilities or missing factors that mattered when decisions were made. section 5.2.2
Use a counterfactual estimate to decide whether a candidate is promising enough to test online, not as proof of real user impact. An A/B test remains important when that impact must be measured. section 5.2.2
