liveBook · Manning

Polynomial feature interaction

As explained in Grokking Machine Learning, Second Edition

A scikit-learn transformer that expands input features into polynomial and interaction features up to a specified degree.

When data follows a curve rather than a straight line, expand a feature into powers such as x, x², and x³. Linear regression can then combine these columns to represent a polynomial curve. section 4.14

Fitting a curved dataset

A downward-opening parabola does not fit well with ordinary linear regression. PolynomialFeatures(degree=20, include_bias=False) and fit_transform(X) create the expanded dataset; linear regression then fits those 21 columns. Split the data before training, and compare unregularized, Lasso, and Ridge models. section 4.14

Figure 4.8 The dataset. Notice that its shape is a parabola that opens downward, so using linear regression won’t work well. We’ll use polynomial regression to fit this dataset, and we’ll use regularization to tune our model.
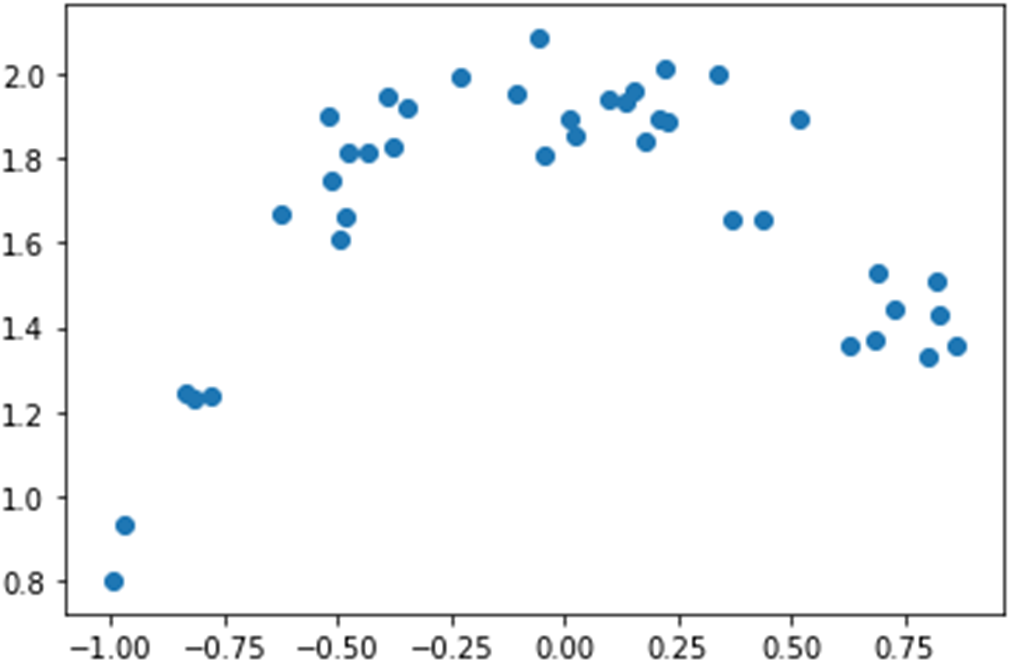
Use the dataset figure to see why a downward-opening curve calls for polynomial regression. section 4.14


How Grokking Machine Learning, Second Edition covers it

How deep it goes
Explains powers, degree, fit_transform, splitting, and regularization, but does not detail multi-feature interaction terms.
Examples
Uses a downward-opening parabola, degree-20 expansion, regularized model comparisons, and coefficient inspection.
What you can do after
Build it from scratch with PolynomialFeatures and fit_transform, then fit linear, Lasso, or Ridge models.
How it connects
Connects polynomial expansion to linear regression, train/test splitting, Lasso, and Ridge.

Also explained in

Compare how 3 books explain polynomial feature interaction →

Related concepts

This explainer was generated by Manning's knowledge graph from the text of Grokking Machine Learning, Second Edition. The section links point to the parts of the book it draws on.