Polynomial regression fits curved functions to data that a straight line cannot model well. A polynomial combines powers of an input, and its degree is the highest power used. section 3.6 section 3.9
Figure 3.26 Polynomial regression is useful when it comes to modeling nonlinear data. If our data looks like the left part of the figure, it will be hard to find a line that fits it well. However, a curve will fit the data well, as you can see in the right part of the figure. Polynomial regression helps us find this curve.
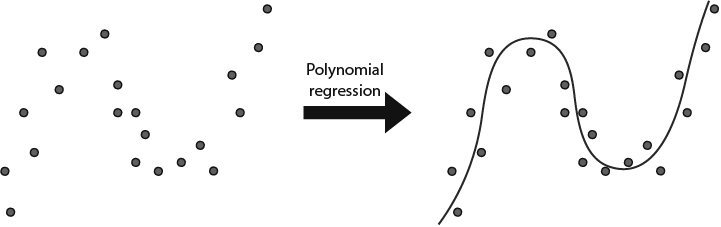
Compare how a curve can fit nonlinear data better than a line. section 3.6
For a one-feature dataset, a Turi Create workflow is to:
- Add columns for powers of the feature, then fit linear regression to the expanded dataset. section 4.6
- Split the data into training and test sets, optionally set L1 or L2 penalties, and predict on the test set. section 4.6
Fitting a parabola
A dataset shaped like a downward-opening parabola is modeled by adding powers of x and fitting linear regression. The demonstrated comparison uses no regularization, L1 regularization, and L2 regularization. section 4.6
