Population Stability Index (PSI) measures how much a distribution shifts between two populations, such as training data and production traffic. It helps explain why offline evaluation may fail to generalize when sampled data no longer represents real usage. section 2.3.4
Use PSI as an early-warning diagnostic, not as a standalone verdict:
- Compare feature distributions between training and production data. section 6.4.2
- Interpret PSI below 0.1 as no significant change, 0.1–0.25 as minor change, and 0.25 or higher as a major population shift. section 6.4.2
- Investigate high values with performance checks, segment analysis, and domain knowledge because PSI does not show whether the shift is harmful or whether labels and performance changed. section 2.3.4
- Use alerts to decide whether to pause an A/B test, investigate a root cause, or adjust analysis for population changes. section 6.4.2
Training data versus production traffic
A monitoring job creates bins from the training feature, counts training and production observations in those bins, normalizes the counts, prevents zero proportions, and calculates PSI. A rising PSI beside retention or other live metrics signals that evaluation reliability deserves investigation rather than proving model failure. section 6.4.2 section 8.7.2
Listing 6.2 Calculating PSI
def population_stability_index(training_feature, production_feature, bins=10):
    """
    Calculate Population Stability Index (PSI) to measure drift
    PSI < 0.1: No significant change
    0.1 ≤ PSI < 0.25: Some minor change
    PSI ≥ 0.25: Major shift in population
    """
    # Create bins based on training data
    _, bin_edges = np.histogram(training_feature, bins=bins)

    # Calculate distributions
    training_counts, _ = np.histogram(training_feature, bins=bin_edges)
    production_counts, _ = np.histogram(production_feature, bins=bin_edges)

    # Normalize to percentages and avoid division by zero
    training_pct = training_counts / len(training_feature)
    production_pct = production_counts / len(production_feature)

    # Add small constant to avoid log(0)
    training_pct = np.maximum(training_pct, 0.0001)
    production_pct = np.maximum(production_pct, 0.0001)

    # Calculate PSI
    psi = np.sum((production_pct - training_pct) * np.log(production_pct / training_pct))

    return psi
Inspect the supplied Python listing for a thresholded PSI calculation using training-derived bins and production distributions. section 6.4.2
Figure 8.5 illustrates a metric drift dashboard mock-up. The left panel shows CTR over time where the stable series fluctuates within normal variance, while the drifting series trends upward beyond the baseline, suggesting feedback-driven distortion. The right panel tracks retention and PSI (Population Stability Index).
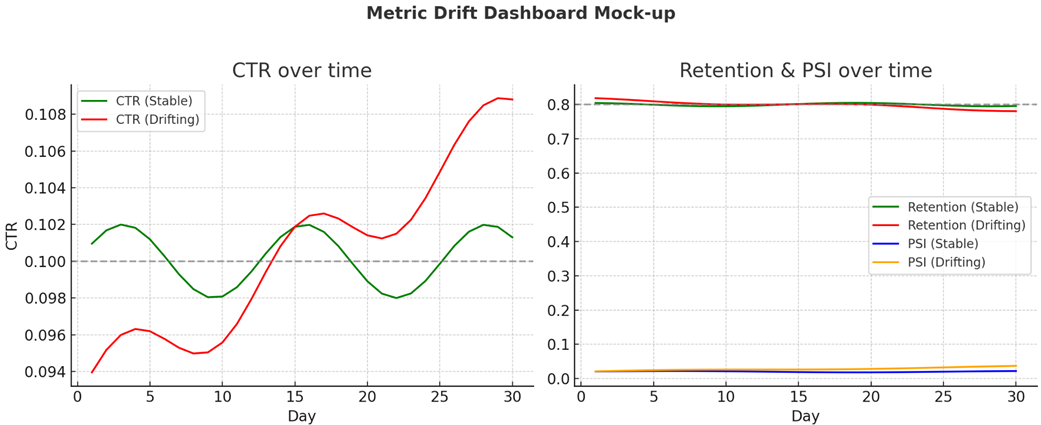
Use the dashboard mock-up to relate PSI to retention and distinguish ordinary metric movement from input drift that can undermine evaluation. section 8.7.2


