A position frequency matrix (PFM) counts how often each of the 20 standard amino acids appears at every aligned position in a protein family. It is built from a filtered multiple sequence alignment: conserved positions concentrate counts in one amino-acid row, while variable positions distribute counts across several rows. section 11.3.2
A practical PFM workflow:
- Create a matrix with one axis for aligned sequence positions and the other for the 20 amino acids. section 11.3.2
- Read aligned sequences, ignore invalid residues, and increment the cell for each observed amino acid at its position. section 11.3.2
- Convert counts into position probabilities with pseudocount smoothing before using them as neural-network features. section 11.3.2
From PFM to protein features
A Python implementation initializes a 20-by-sequence-length NumPy matrix, counts residues from aligned lines matching the target length, applies a pseudocount, and combines the resulting position-specific features with sequence features. section 11.3.2
Figure 11.7 Derivation and Interpretation of a PSSM. (a) MSA of related protein sequences. Each column represents a position in the sequence. Some positions are highly conserved across sequences (e.g., position 8, dominated by Tryptophan, W), indicating functional or structural importance. Other positions are more variable (e.g., position 5). (b) The PSSM derived from the MSA. It is a matrix of log-odds scores where each cell quantifies the likelihood of a specific amino acid occurring at a specific position compared to its background frequency. The highly conserved Tryptophan at position 8 has a large positive score (dark green). (c) This quantitative representation allows for easy interpretation, clearly distinguishing conserved positions from variable ones.
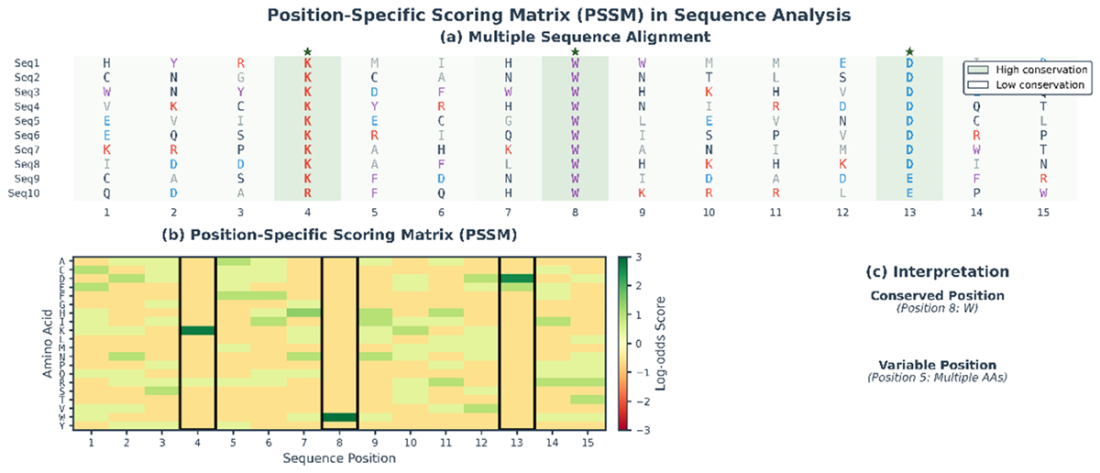
Compare conserved and variable alignment columns with their derived scoring representation. section 11.3.2
