A position-specific scoring matrix (PSSM) converts evolutionary information from a multiple sequence alignment into residue features that vary by sequence position. It captures which amino acids evolution favors at each position, helping distinguish conserved functional or structural sites from more variable regions. section 11.3.2
For a protein of length L, a conventional PSSM has shape L×20: each cell represents one standard amino acid at one sequence position. Traditional values are log-odds scores comparing observed and background frequencies; DGraphDTA instead uses a simplified position probability matrix as a neural-network feature. section 11.3.2
Generate and use the matrix through this feature pipeline:
- Search for homologous sequences with HHblits to create a multiple sequence alignment. section 11.3
- Filter sequences above 90% identity with HHfilter, reducing redundancy before feature calculation. section 11.3
- Count aligned residues position by position, handle unknown or invalid residues, and calculate the PSSM from the filtered alignment. section 11.3.2
- Transpose the resulting matrix and concatenate it with one-hot and biochemical residue features to form node features for a protein graph. section 11.3.2
Conserved versus variable positions
An alignment column dominated by tryptophan at position 8 produces a strong positive preference for tryptophan, while a more variable column produces less concentrated scores. The resulting values let a graph neural network represent positional evolutionary constraints alongside intrinsic amino-acid properties. section 11.3.2
Figure 11.7 Derivation and Interpretation of a PSSM. (a) MSA of related protein sequences. Each column represents a position in the sequence. Some positions are highly conserved across sequences (e.g., position 8, dominated by Tryptophan, W), indicating functional or structural importance. Other positions are more variable (e.g., position 5). (b) The PSSM derived from the MSA. It is a matrix of log-odds scores where each cell quantifies the likelihood of a specific amino acid occurring at a specific position compared to its background frequency. The highly conserved Tryptophan at position 8 has a large positive score (dark green). (c) This quantitative representation allows for easy interpretation, clearly distinguishing conserved positions from variable ones.
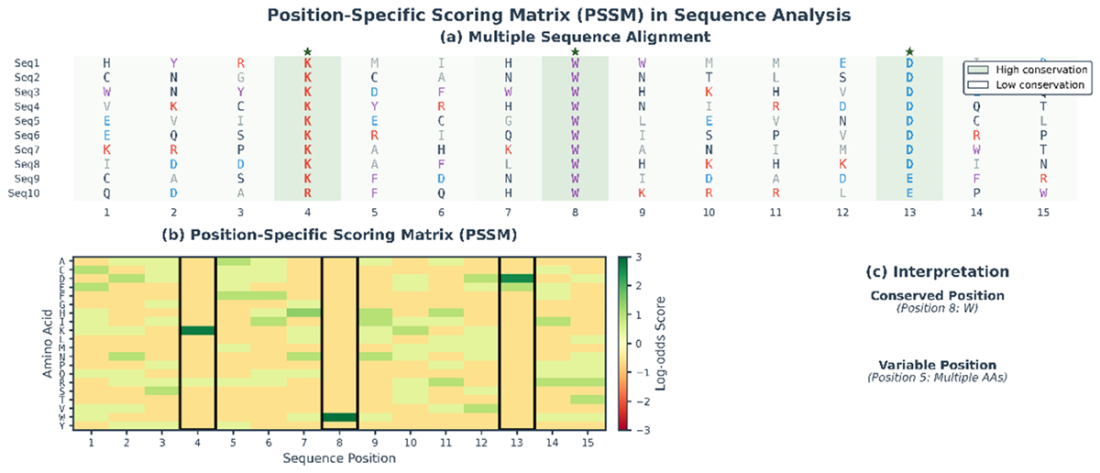
Inspect the derivation from aligned sequences to position-specific scores and the visual contrast between conserved and variable positions. section 11.3.2
