A predictive distribution describes several plausible outcomes rather than committing to one number. It makes uncertainty visible: a narrow range suggests concentrated predictions, while a wide range signals that many outcomes remain plausible. section 10.0
For separate school models, the coaching effect for school i is represented by a random variable θᵢ. If the estimated effect is 28 with standard deviation 15, the model writes θ₁ ~ 𝒩(28, 15²). The distribution shows the possible range of score increases, not merely the estimated average. section 7.2
Predictive distributions support several practical readings:
- Compare uncertainty as well as central estimates: overlapping school distributions make it difficult to claim that one coaching program is better than another. section 7.2
- Summarize predictions with a mean while retaining variability as an estimate of predictive uncertainty. section 10.6
- Extend uncertainty-aware prediction to neural networks by placing distributions over parameters instead of fixing one parameter set. section 10.0
Monte Carlo dropout
Keep dropout active at prediction time and run the same input through the network repeatedly. Each pass removes a different subset of nodes and produces one prediction. Together, these predictions form an approximate predictive distribution; their average gives a mean estimate, and their spread indicates uncertainty. section 10.6 section 10.9
Figure 10.12 At test time, for a given input, we perform multiple forward passes with dropout enabled to obtain a distribution of predictions, which serves as our predictive distribution for that input.
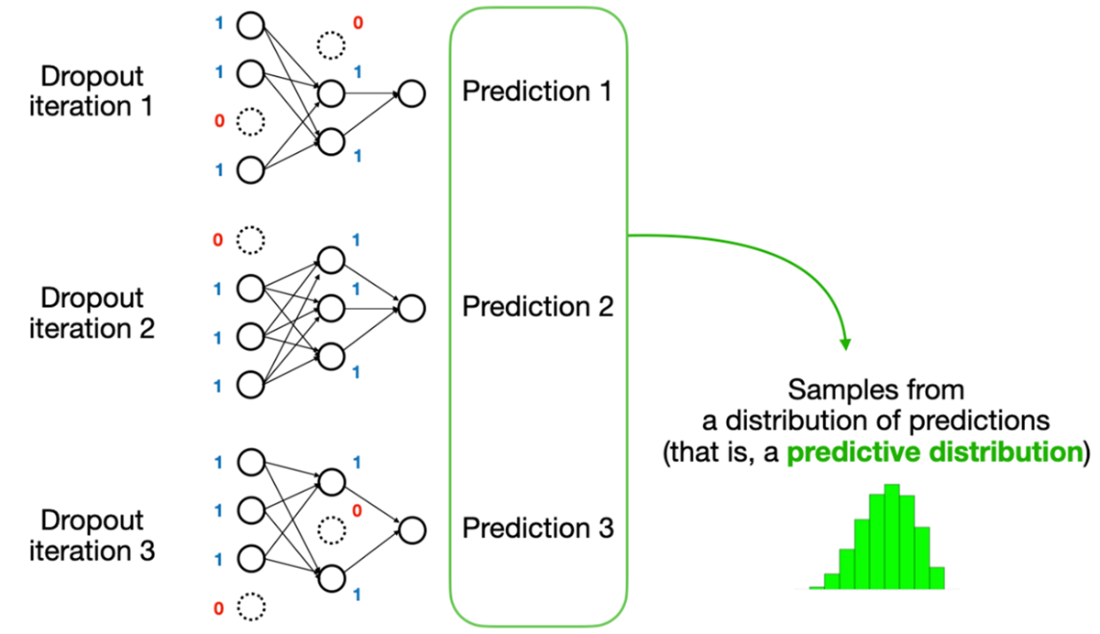
Visualizes how repeated dropout-enabled forward passes turn one input into a distribution of predictions. section 10.6