When API design changes take too long, a process map makes the delivery workflow visible before anyone chooses what to automate. It shows the sequence of activities, the flow of work and information, and the time taken at each step. For an APIOps improvement, adapt value stream mapping (VSM) notation to the process level rather than mapping only high-level organizational processes. section 2.0 section 2.4
Build the current-state map around a customer request:
- Put the activities in sequence and record the metrics gathered for each step. section 2.4
- Show work waiting between steps with inventory triangles. A queue might be the number of Jira tickets awaiting processing. section 2.4.3
- Add a time ladder: place TT at the top and LT at the bottom for each block, then show their totals. section 2.4.3
- Review the map for wasteful activities to eliminate and value-adding activities to improve before selecting APIOps automation. section 2.14
An API design-change queue
Creating a design-change ticket takes 0.25 hours, with no delay between TT and LT. Updating the API definition takes engineers 3 hours of work, but six tickets ahead of it extend that step’s LT to four days. Engineers have complete information 85% of the time. A central gateway team then faces four design-review tickets in its backlog; its twice-weekly reviews mean this ticket waits 11 working days to be reviewed. These figures point to queues and missing information as problems that a simple list of task durations would hide. section 2.4.4
Figure 2.7 Completed Current Conditions and Problem Statement section, showing the process map with metrics
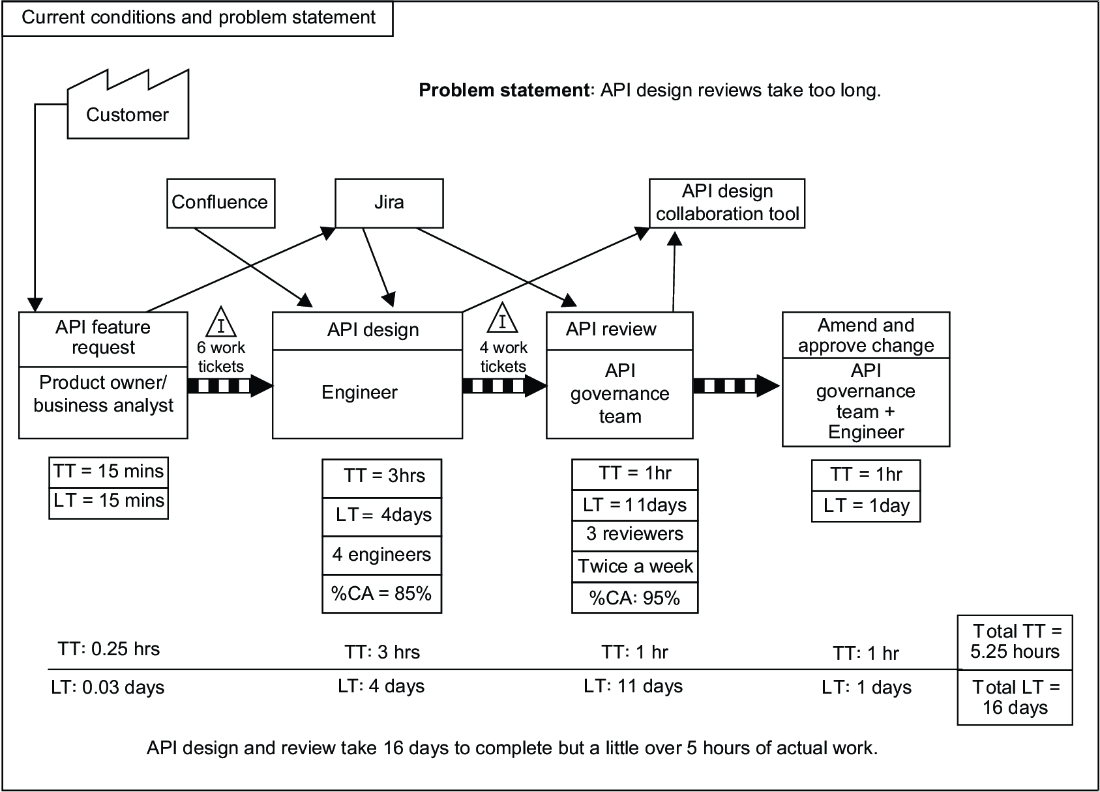
The completed current-conditions map places process metrics alongside the workflow, making delays and backlogs easier to inspect. section 2.4.3
