Quasi-diagonalization, also called seriation, reorders the rows and columns of a covariance matrix so assets that are close in the distance matrix sit together. The resulting correlation structure is approximately block-diagonal, making related groups visible and preparing the asset order used by hierarchical risk parity. section 11.2.4
Start from the final linkage-matrix cluster and repeatedly replace each cluster with its two constituents. Continue until only original asset indices remain; use those indices to reorder the covariance or correlation matrix. This is an ordering procedure, not a change to the underlying correlations. section 11.2.4
Figure 11.6 Visual depiction of the cluster-splitting process, resulting in reordered assets
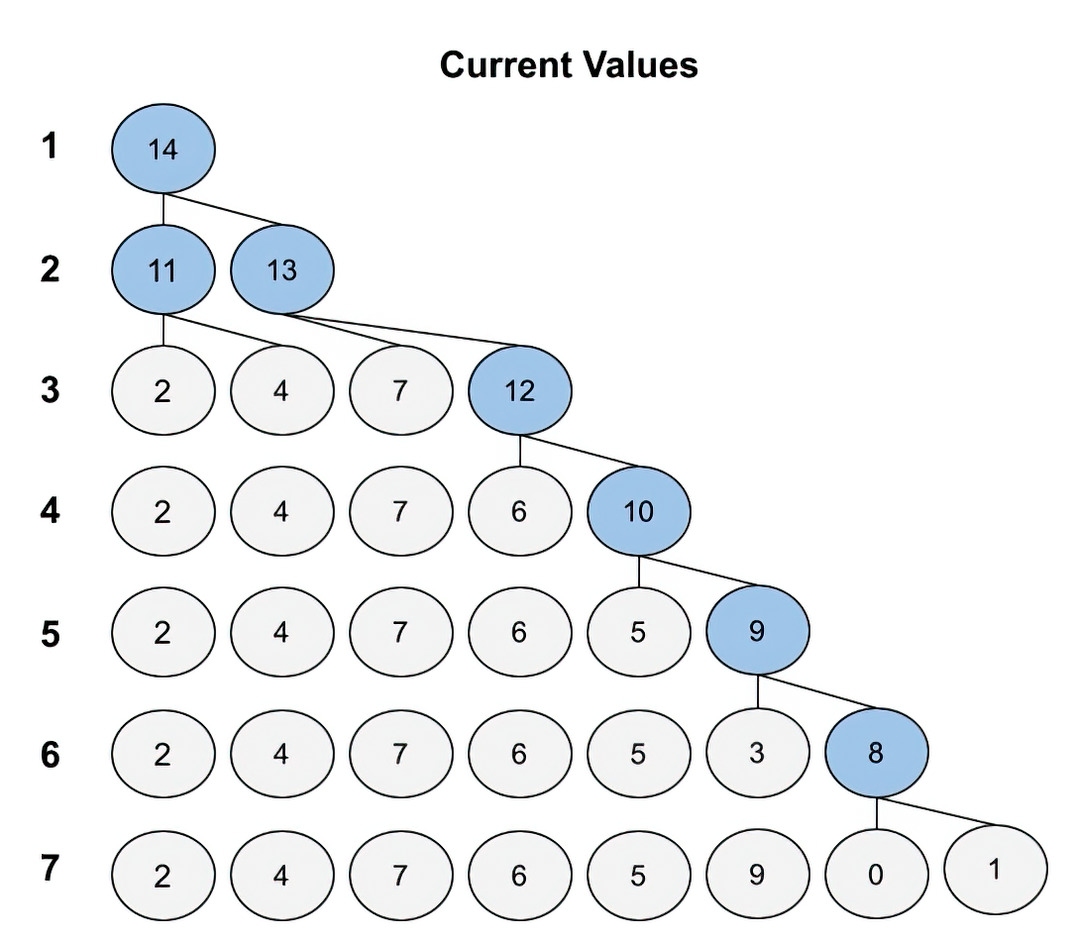
The cluster-splitting diagram shows how expanding the top-level cluster yields a final sequence of individual assets. section 11.2.4
Eight-asset ordering
For VV, VB, AGG, VEA, BNDX, VWO, EMB, and DJP, cluster expansion produces the order AGG, BNDX, DJP, EMB, VWO, VEA, VV, VB. Plotting the correlation matrix in that order places similar assets near one another. section 11.2.4
