A recording rule is a named Prometheus expression evaluated and stored as a derived time-series value, giving repeated calculations a convenient shortcut. section 11.1.2 section 11.4
Average read latency
Combine the total read-latency metric with its request-count metric: sum(scylla_storage_proxy_coordinator_read_latency_sum) divided by sum(scylla_storage_proxy_coordinator_read_latency_count). A recording rule can provide this result directly for monitoring and dashboards; a related rule exposes rlatency95, the 95th-percentile read latency. section 11.1.2
Recording rules support the monitoring workflow by:
- Reducing repeated PromQL work for complex metric calculations. section 11.4
- Supplying reusable values to Grafana dashboards and visualizations. section 11.4
- Supporting application-specific alerts and visualizations when existing queries are insufficient. section 11.1.2
Figure 11.3 PromQL combines metrics, labels, functions, and recording rules to help you query and transform ingested metrics.
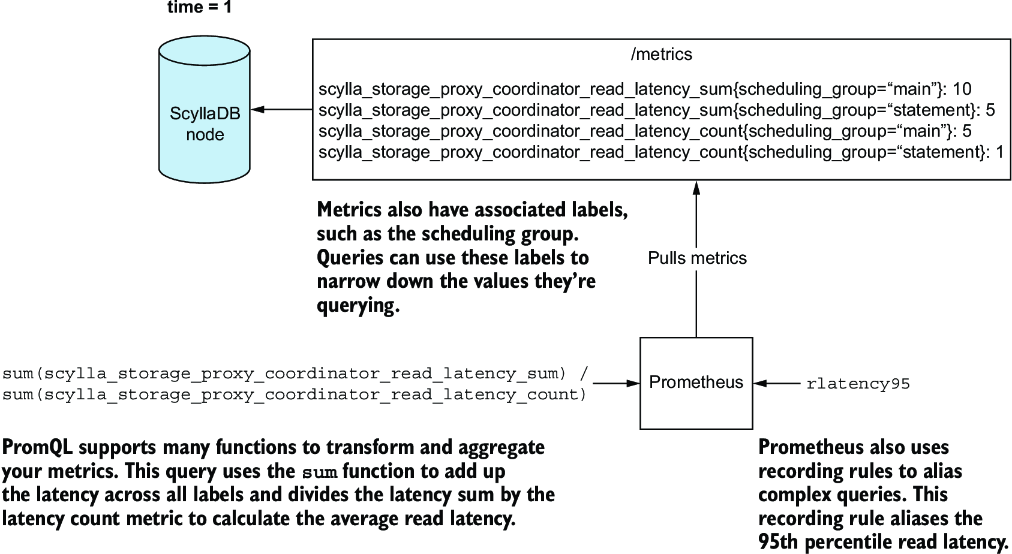
Shows how PromQL combines metrics, labels, functions, and recording rules to query and transform ingested metrics. section 11.1.2

