A reference dataset is a collection of observations used as a basis for comparing new observations or assessing what is typical. Its usefulness depends on whether it represents the relevant normal state: older data may be obsolete, while recent data may itself be atypical. section 4.14
Choose the reference data according to the monitoring situation:
- Use an established reference set to detect data drift, support frequent arrivals, handle streaming data, or compensate for slowly arriving observations. section 4.14
- Prefer verified high-quality periods when historical data is known to contain no defects, such as a stable industrial process. section 4.14
- Compare against multiple reference points when no single period reliably represents the expected behavior; use a rolling window when conditions change over time. section 4.14
- Balance reference-set size against computation: larger sets can improve distance-based prediction but make methods such as LOF and KNN slower. section 10.2.1
In subspace outlier detection, a reference set is the neighborhood of k points used to identify the features that explain the greatest variance around each observation. Shared nearest neighbors can make this comparison more robust in high-dimensional data with irrelevant features. section 6.10
A high-dimensional reference set
A synthetic dataset contains 35 features, with correlated features 8 and 9 and one inserted outlier. SOD uses a reference set of three neighbors and flags the point because its relationship between those features is unusual, although its other features are typical. section 6.10
Figure 6.14 The left pane shows point A in a 2D dataspace. The point is unusual considering feature A but not if using Euclidean distances in the full 2D dataspace. Using additional features can be counterproductive. In the middle and right panes, we see another point, point B, which is an outlier in the C–D subspace but not in the E–F subspace. We need only features C and D to identify this outlier.
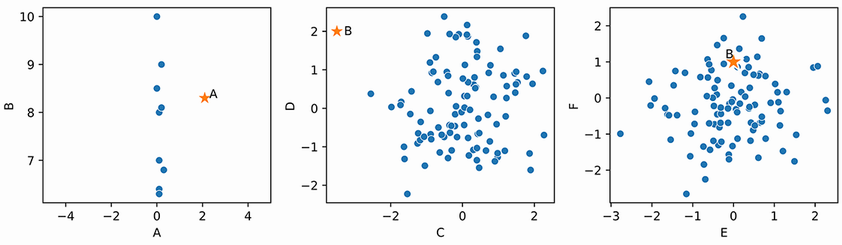
Shows why a reference set or selected subspace can reveal an outlier that appears ordinary when all features and Euclidean distance are considered together. section 6.10

