When choosing whether to treat a patient under uncertainty, a decision tree lays out available actions, possible events, and their consequences. Rollback evaluates this tree from its endpoints toward its beginning: at chance nodes, it combines outcome utilities with their probabilities; at decision nodes, it selects the action with the highest expected utility. section 7.1.2
For a chance node, expected utility is the sum of each outcome’s probability multiplied by its utility. This makes the tree a way to compare specified actions under uncertainty, not a method for learning predictive rules from data. section 7.1.2 section 7.6
Treatment decision
A treatment tree assigns a 0.09 probability to disease and 0.91 to its absence. Rolling back gives expected utilities of −0.1 for treating and 91 for not treating, so the latter is preferred under the assigned probabilities and utilities. section 7.1.2
Figure 7.1 Decision tree for the treatment decision. The square node represents the choice between treating and not treating. Each action leads to a circular chance node representing whether disease is present (𝑝 = 0.09) or absent (𝑝 = 0.91). The terminal branches show the four possible outcomes and their assigned utilities. Rolling the tree back combines the probabilities and utilities to produce expected utilities of −0.1 for treating and 91 for not treating, making the latter the preferred action.
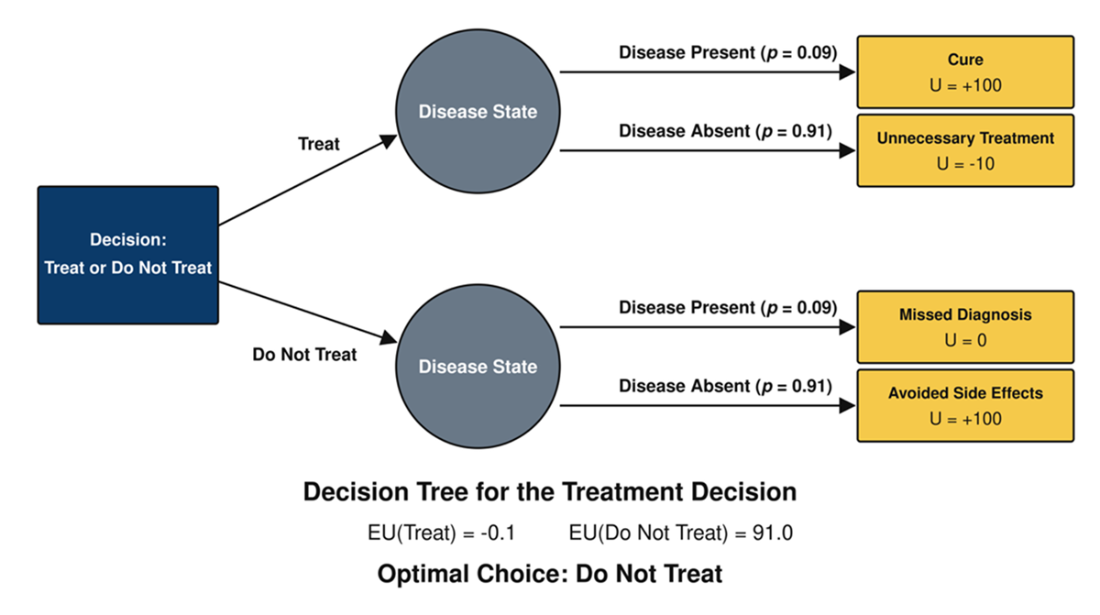
The tree displays the treatment choice, uncertain disease state, assigned utilities, and rollback results. section 7.1.2
