A saliency map is a local explanation that highlights which regions of an input are most sensitive to a model’s output. For an image, it computes output gradients with respect to the input and displays a heatmap: each pixel indicates how much changing it could affect the prediction. The same idea can target words, characters, audio frequencies, or more complex attributes. section 11.2.3
Use saliency maps to:
- Inspect which visual regions a deep learning model appears to use when producing a prediction. section 11.2.3
- Distinguish gradient-based explanations from perturbation methods, which alter or remove input features and track output changes. section 11.2.3
- Treat the result as an informative but non-universal explanation, because explainable deep learning remains an active research area. section 11.2.1
Reading an image heatmap
Given an image prediction, overlay the saliency map on the image and inspect the pixels with the strongest response. Those regions indicate where changing the input would most affect the model’s output; they do not by themselves establish that the model recognized the intended object. section 11.2.3
Figure 11.5 Examples of output saliency maps generated by different methods (source: https://arxiv.org/abs/1709.05307)
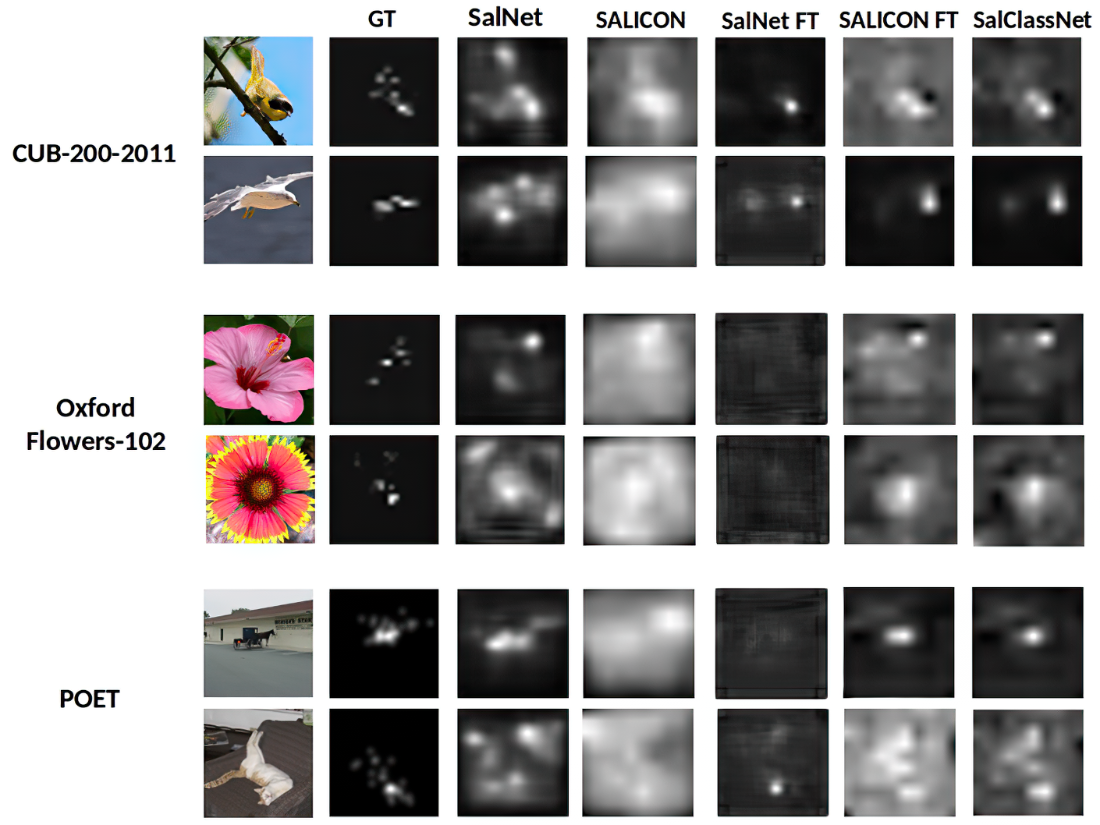
Compare output heatmaps produced by different saliency-map methods to build intuition about how their highlighted regions vary. section 11.2.3
