Sample-based profiling estimates where execution time goes by checking program state at regular intervals. It usually adds less overhead than recording every function call, making it a practical starting point for realistic performance measurements. section 7.3.1 section 7.2.3
Use a repeatable workflow to turn samples into actionable performance findings:
- Profile representative user activity for at least 30 seconds: navigate screens, scroll lists, trigger animations, or perform common operations. section 7.3.1
- Inspect the ranked call tree or flame graph, expanding the heaviest path through framework calls until it reaches application functions. section 7.3.1 section 7.2.3
- Treat processor activity according to context: user-requested calculations may be expected, while activity during apparent idleness suggests unnecessary background work. section 7.3.1
Sampling gives an honest view with limited measurement drag, whereas trace-based profiling records every call and can alter timing. Use tracing when exact sequences are needed for a specific problem. section 7.3.1
Reading cumulative and internal time
Python cProfile can sort function statistics by cumulative time. A function such as serialize_response with 400 ms of cumulative time but 5 ms of internal time is mostly a gateway to slower callees; investigate its call chain rather than optimizing serialization immediately. High internal time identifies work performed directly by the function. section 7.2.3
Figure 7.5 An example call tree showing where time is spent. The top rows are system code you cannot change. Keep expanding until you reach your own functions at the bottom, which is where you focus your attention to improve performance.
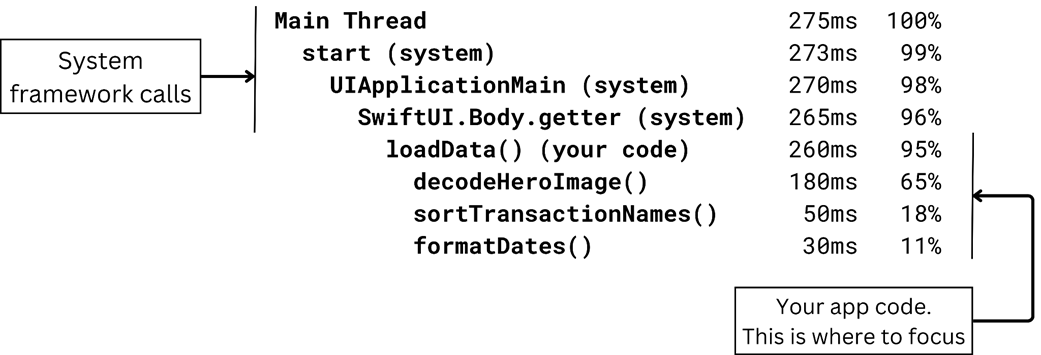
A call-tree figure makes the investigation path concrete: move past costly system rows until your own functions become the optimization targets. section 7.3.1

