A sample point distribution is a collection of values drawn from a random variable, viewed as points in that variable’s domain. It gives a geometric picture of the distribution that produced the samples: regions assigned higher probability contain more points, while lower-probability regions are sparse. The resulting collection is also called a sample point cloud. section 5.8 section 5.10
Each draw is one possible value, not a probability by itself. In one dimension, a sampled scalar is a point on a number line. In multiple dimensions, a sampled vector is a point in a higher-dimensional feature space. With enough points, the cloud can represent population-level structure well enough to analyze aggregate properties. section 5.8
Read a sample point distribution by comparing its visible structure with properties of a probability distribution:
- Dense regions correspond to values that occur more often and therefore have higher probability or density. section 5.8
- The sample mean and sample variance summarize a finite cloud when the underlying distribution is unknown; increasing the number of samples improves the mean’s approximation of the true mean. section 5.8
- A diffused cloud corresponds to a flatter PDF and higher entropy, whereas concentrated regions correspond to tall PDF peaks and lower entropy. section 6.2.1
- A large-sample cloud motivates expected value as the average point value and variance as the spread of point values around the mean. section 5.10
Gaussian mixture model: clusters as sampled structure
A Gaussian mixture model (GMM) can be understood through the sample distribution it generates. Its number of components K influences the number of peaks in the PDF and clusters in the cloud. A component mean μk sets a peak and cluster centroid; covariance Σk sets their shape; mixture weight πk controls relative hill heights and the corresponding representation of components in the sampled cloud. Nearby peaks or clusters may merge visually. section 6.9.1 section 6.9.1
This geometry also supplies a fitting objective. Given unlabeled training points, maximum likelihood estimation seeks model parameters whose generated sample cloud overlaps the training-data point cloud. For a GMM, the observed cloud should exhibit natural subclouds; fitting estimates component weights, means, and covariances for a fixed number of components. Unlike a single Gaussian, GMM maximum likelihood requires iterative approximation rather than a closed-form solution. section 6.6.2 section 6.9.4
Figure 6.12 Progression of maximum likelihood estimation for GMM parameters
|
(a) Training data point cloud (target for fitting) |
|
(b) Fitted GMM’s sample point cloud at step 0 |
|
(c) Fitted GMM’s sample point cloud at step 5 |
|
(d) Fitted GMM’s sample point cloud at step 15. It almost matches the target. |
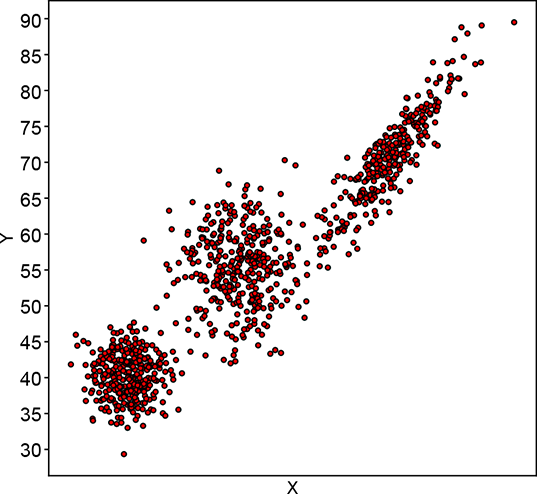
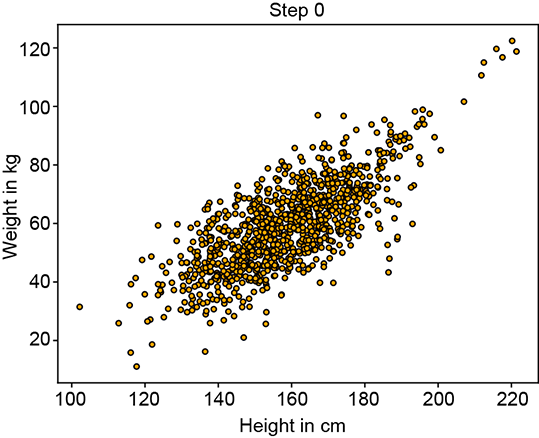
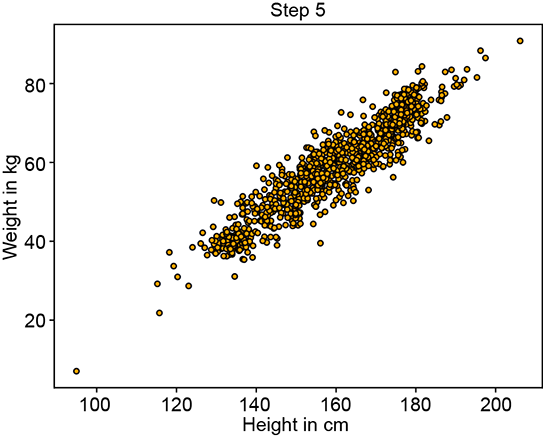
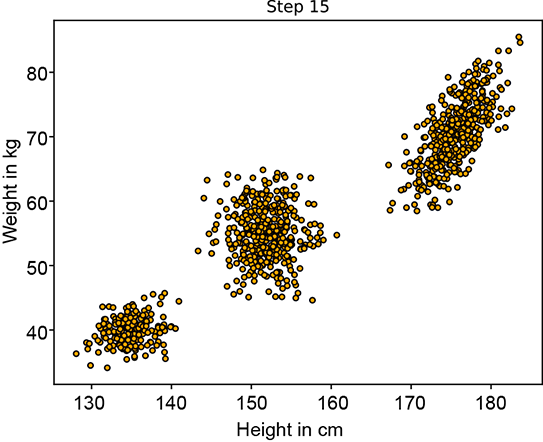
Compare the target training-data cloud with successive fitted GMM clouds to see likelihood-based fitting progressively improve their overlap. section 6.9.4
