A sanity check is a quick, practical validation that asks whether data and derived results are plausible enough to trust for the next analytical step. It looks for obvious gaps, unexpected ranges, inconsistent labels, unusual volumes, and results that conflict with known domain context. The aim is not to prove data perfect; it is to expose assumptions, decide what matters for the question, and record limitations before transforming, aggregating, or prototyping. section 4.4.1 section 10.4.1 section 2.2.2
A useful sanity-check sequence is:
- Confirm the combined dataset has the expected shape and date range independently of file names or stated coverage. section 4.4.1 section 10.4.1
- Count missing values, then inspect affected records before deciding whether missing fields matter to the current analysis. section 4.4.1 section 10.4.1
- Check completeness within an expected range, such as whether every day has events rather than merely whether minimum and maximum dates look right. section 4.4.1
- Inspect distributions and extreme values, then investigate their context before filtering or correcting them. section 4.4.1 section 10.4.1
- Test category or entity consistency, such as whether one product has multiple categories or brands, and apply a documented correction when evidence supports it. section 4.4.1
- Compare derived values with an external reference or domain expectation; treat mismatches as leads to investigate, not automatic errors. section 2.2.2
Event data across November and December
After concatenating more than seven million product events, check null counts, verify dates span November 1 through December 31, count distinct days in each month, and plot events per calendar day. Low-activity days may be genuine behavior, a collection issue, or a reason to ask for more context. Next, inspect event types, prices, and product categories; a product assigned conflicting categories can require a correction before category-level metrics are calculated. section 4.4.1
Property-sale prices
For combined 2021–2023 sale records, locate missing address fields and inspect samples to judge their meaning. Use summary statistics and record samples to investigate very low prices, checking category type for context. Inspect implausibly high prices separately, then remove values above a stated threshold only after that investigation. This keeps a cleaning decision tied to observed data rather than an unexplained rule. section 10.4.1
Checking a derived city field
After extracting city names from customer addresses, compare the unique tagged cities with a government city list. A missing expected city may indicate no customers, an abbreviation, or a tagging failure. Here, Kingston-upon-Hull is found as “Hull” in addresses and the tagged values are manually corrected, showing why domain knowledge and review of exceptions matter. section 2.2.2
Figure 4.6 Number of events per calendar day, visualized
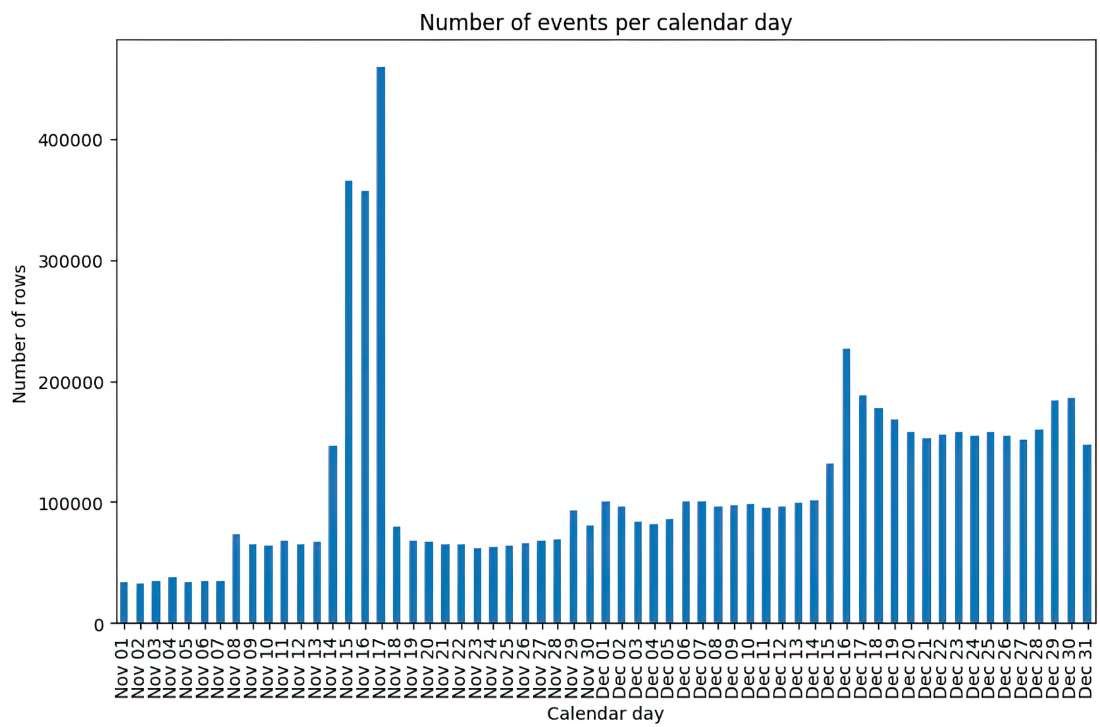
The daily event-volume chart makes gaps and unusually low or high activity visible after date-range and day-count checks. section 4.4.1
