Sentry is a real-time error monitoring platform that collects and organizes unhandled exceptions, stack traces, and runtime errors. It adds context such as the failed line of code, user identifiers, HTTP request details, code-version tags, local variables, environment details, and release metadata. section 12.1.2 section 12.3.1
Use Sentry alongside tracing rather than instead of it. Tracing shows the flow and timing across services; Sentry shows the failure in detail. A shared trace or correlation ID can connect an exception to the request path and speed root-cause investigation. section 12.1.2 section 12.3.1
Sentry helps investigators ask focused questions about distributed failures:
- Which exception occurred, and at which line of code? section 12.1.2
- Which service, release, user, request, or error type is affected? section 12.1.2 section 12.3.1
- Is the reported error the first failure, or a downstream symptom of a cascading failure? section 12.3.1
Kafka deserialization failure
A fulfillment service silently fails to process a Kafka message containing the unrecognized enum value SHIPPING_METHOD_DRONE. With Sentry integrated, the deserialization exception becomes an organized event that developers can investigate alongside its runtime context. Similar evidence can expose failed gRPC calls, bad deserialization, and unexpected response types. section 12.1.2
Cascading service failure
When a database connection pool is exhausted, Sentry can capture SQLTransientConnectionException or TimeoutException and alert the team. Upstream order and checkout services may then produce timeout, circuit-breaker, or retry-related errors. Grouping those events by service, error type, user ID, and request ID helps reveal the ripple effect. section 12.3.1
Figure 12.4 Sentry aggregates and shows events such as exceptions providing a large field of details for each of these.
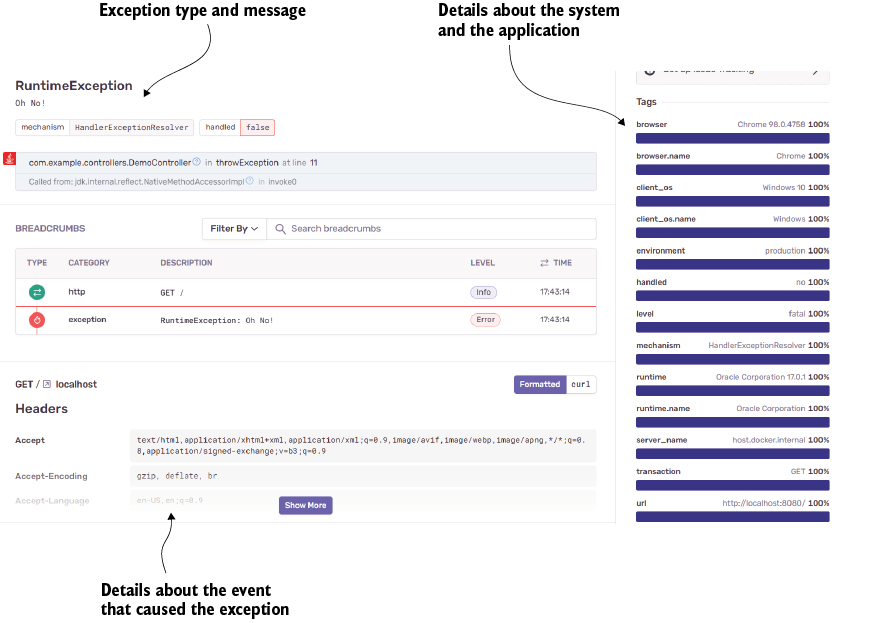
Use the event view to inspect how Sentry aggregates exceptions and exposes detailed fields for investigation. section 12.1.2
