How can a classifier become a little better each time it sees a labeled example? The logistic trick updates its boundary using the prediction error. Correctly classified points push the boundary farther away, while incorrectly classified points pull it closer. This makes predictions move toward 1 for label 1 and toward 0 for label 0. section 6.2 section 6.6
Apply the trick to one example at a time:
- Compute the prediction ŷ with the sigmoid of the weighted feature sum plus the bias. section 6.3
- Calculate the error y − ŷ. section 6.2
- Update every weight with wi ← wi + η(y − ŷ)xi and update the bias with b ← b + η(y − ŷ). section 6.3
- Repeat for randomly selected points and track total log loss to monitor improvement. section 6.2 section 6.3
A four-point classifier
A small dataset starts with predictions 0.953, 0.731, 0.119, and 0.119. Applying the trick produces updated weights and bias, including a model with weights approximately 0.47 and 0.10 and bias −0.68. Repeating the updates lowers the plotted error over more epochs. section 6.2 section 6.3
Figure 6.10 Left: A plot of all the intermediate steps of the logistic regression algorithm. Notice that we start with a bad classifier and slowly move toward a good one (the thick line). Right: The error plot. Notice that the more epochs we run the logistic regression algorithm, the lower the error gets.
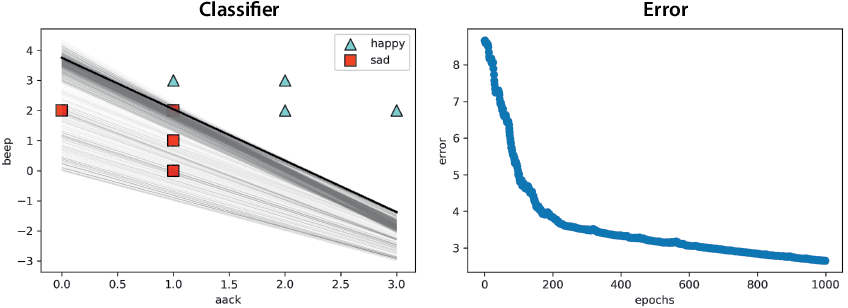
Use the training-path and error plots to see a poor boundary gradually move toward a better classifier. section 6.3
