The square trick nudges a line toward one data point at a time. It uses the signed prediction error to update both the slope and the y-intercept. section 3.3
For a point with feature value x and target y:
- Calculate the prediction: predicted = intercept + slope × x. section 3.3
- Compute the signed error: y − predicted. section 3.3
- Update the intercept by learning rate × error. section 3.3
- Update the slope by learning rate × x × error. section 3.3
Moving a house-price line
For a house-price model, the slope represents price per room and the intercept represents the base price. If the actual price is above the prediction, the positive error moves the line upward; the feature value also determines how much the line rotates. Repeating this with randomly selected points produces a fitted linear regression line. section 3.3
Figure 3.6 An illustration of the linear regression algorithm. We start at the top left with a random line and end in the bottom left with a line that fits the dataset well. At each stage, two things happen: (1) we pick a random point, and (2) the point asks the line to move closer to it. After many iterations, the line will be in a good position. This figure has only three iterations for illustrative purposes, but in real life, many more iterations are needed.
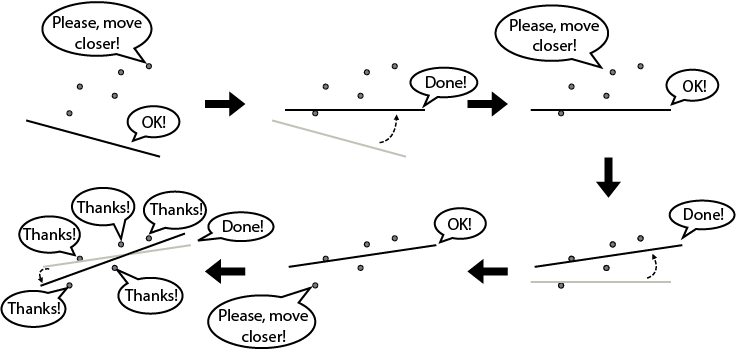
Visualizes repeated random-point updates from an initial random line toward a line that fits the dataset. section 3.3
