A similarity graph represents data points as nodes and connects pairs whose similarity is positive or exceeds a threshold. Edge weights express relative similarity: stronger connections indicate points more likely to belong to the same cluster. section 5.3.1
Represent the graph through these related structures:
- Adjacency matrix: places nodes on rows and columns, using 1 for a connection and 0 for no connection; nonoriented graphs produce symmetric matrices. section 5.3.1
- Degree matrix: records each node’s number of connections on the diagonal. section 5.3.1
- Laplacian matrix: subtracts the adjacency matrix from the degree matrix and supports spectral clustering. section 5.3.1
Figure 5.4 A graph is a simple representation of data points. The points or nodes are connected by edges if they are very similar (left). The weight is higher if the similarity between data points is high; for dissimilar data points, the weight is less (right).
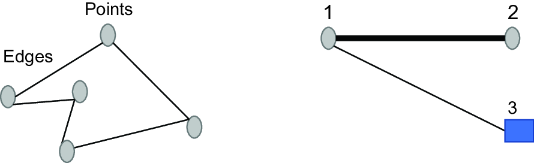
Compare unweighted connections with weighted edges, where larger weights indicate greater similarity. section 5.3.1
