A smoothing parameter controls how strongly a new observation influences a smoothed estimate relative to accumulated historical information. Values between 0 and 1 determine the balance: larger weight on recent observations makes the estimate more responsive, while retained historical weight reduces noise. Exponential smoothing applies this idea through weighted averages whose influence decreases exponentially over time. section 7.4.3 section 14.3.5
Use the parameter differently according to the structure being modeled:
- Simple exponential smoothing uses one factor for series without trend or seasonality and supports short-term forecasts. section 7.5
- Double exponential smoothing adds a trend-smoothing parameter for series with trend but no seasonal pattern. section 7.5
- Holt–Winters smoothing adds seasonal smoothing for series containing both trend and seasonal variation. section 7.5
- EWMA control charts use the constant to emphasize recent measurements and detect small shifts in a process mean. section 14.3.5
Monitoring piston-ring diameters
An EWMA chart initializes its first value with the first measurement, then combines each current piston-ring diameter with the previous EWMA value. The smoothing constant controls this weighting; control limits indicate whether the process may be shifting out of control. section 14.3.5
Figure 14.9 This EWMA chart displays the exponentially weighted moving average of piston ring diameters across 40 samples. The chart shows how the process mean evolves over time, with recent data points having more influence on the chart’s trajectory than older ones. The CL represents the overall EWMA mean, whereas the UCL and LCL indicate the expected range of variation. Data points within these limits suggest the process is under control, whereas any point outside may signal a shift or trend that requires further investigation.
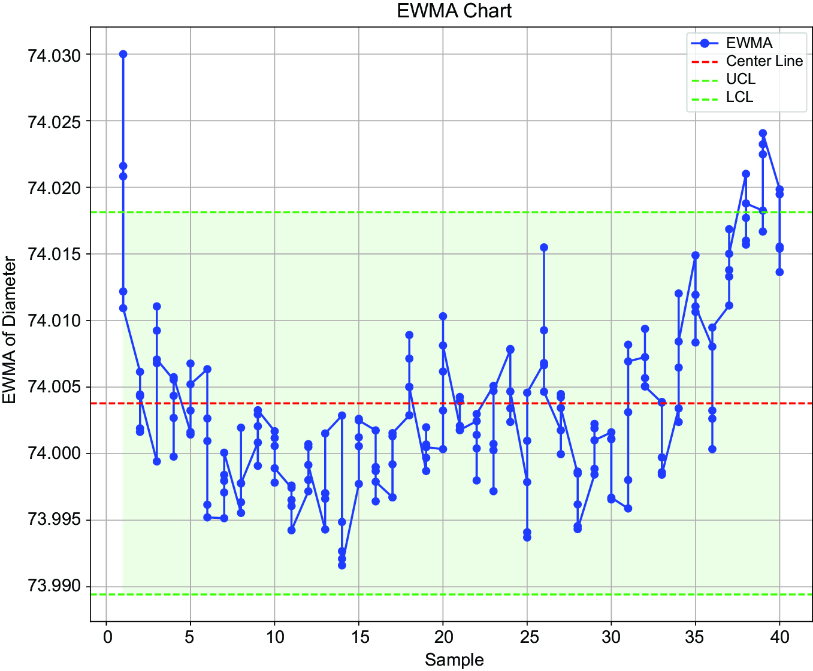
Inspect the EWMA chart to see how recent piston-ring measurements influence the process trajectory and how control limits signal possible shifts. section 14.3.5
