The visible spectrum is the range of light wavelengths detectable by human eyes and perceived as colored light. Different wavelengths stimulate cone cells by different amounts, producing different colors. section 4.1.1
Three ideas make the spectrum easier to recognize:
- ROY G. BIV names the familiar sequence red, orange, yellow, green, blue, indigo, and violet. section 4.1.1
- The additive model treats colored light as cumulative: combining the spectrum’s colors produces white light. section 4.1.1
- Counting colors is less tidy than the mnemonic suggests; a real spectrum blends continuously. section 4.1.1
A rainbow as a natural prism
Sunlight is essentially white. Raindrops bend its different wavelengths by different amounts, separating the light into the colored arc we see as a rainbow. section 4.1.1
Figure 4.1 A ray of white sunlight enters a prism and exits as a rainbow because the prism causes the different wavelengths in the white light to separate. (Prism-rainbow.svg: Suidrootderivative work. Sceptre, CC BY-SA 3.0, via Wikimedia Commons. Labels added by me)
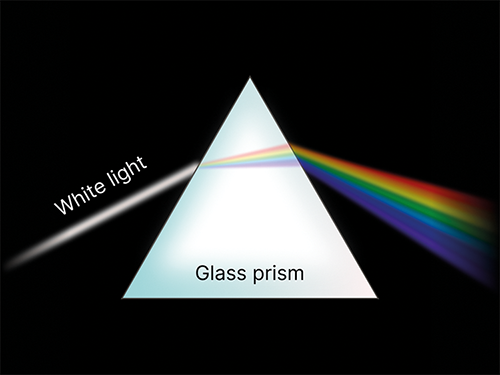
Trace how white sunlight enters a prism, separates by wavelength, and exits as a rainbow. section 4.1.1
