starlette_exporter adds basic Prometheus metrics to Starlette-based applications, making request volume and response performance visible to an operational monitoring stack. section 3.5
Expose metrics from a FastAPI application
from fastapi import FastAPI from starlette_exporter import PrometheusMiddleware, handle_metrics app = FastAPI() app.add_middleware(PrometheusMiddleware) app.add_route("/metrics", handle_metrics) @app.get("/") async def root(): return {"status": "ok"} section 3.5
The exposed metrics support several operational views:
- Counters track request totals through metrics such as starlette_requests_total. section 3.5
- Gauges represent values that can rise or fall, such as memory consumption. section 3.5
- Histograms group response times into buckets for percentile reporting. section 3.5
Figure 3.17 Application 1 and Application 2 expose an endpoint for metrics. Prometheus scrapes those metrics, which are then visualized by Grafana. Alertmanager uses those metrics to check if any alerts need to be routed to a channel; in this case, it’s an email.
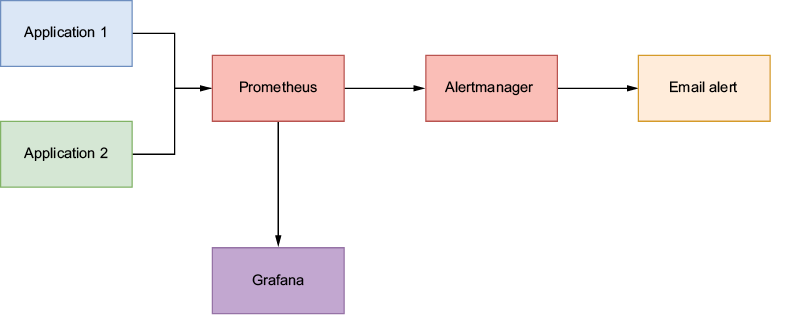
Connects the application's /metrics endpoint to Prometheus scraping, Grafana visualization, and Alertmanager routing. section 3.5
