liveBook · Manning

Squared loss

As explained in Grokking Machine Learning

A regression error metric equal to the sum of squared differences between observed and predicted target values.

For a regression line, squared loss adds the squares of the vertical differences between the observed points and the line’s predictions. A smaller total indicates a closer fit; a larger total indicates a poorer one. section 3.4

Figure 3.19 The square error is the sum of the squares of the vertical distances from the points to the line. Note that the square error is large for the bad model on the left and small for the good model on the right.
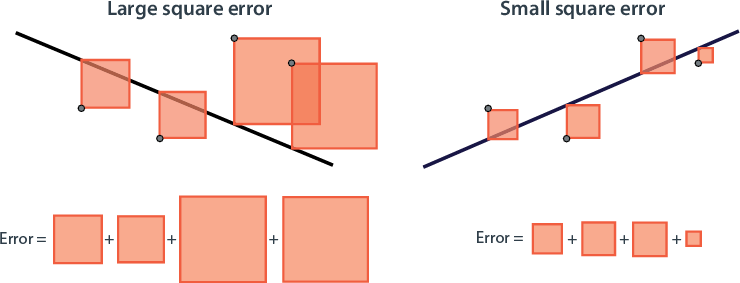
Compare the squared distances for a poor-fitting line and a close-fitting line. section 3.4


How Grokking Machine Learning covers it

How deep it goes
Defines the metric as a sum of squared vertical distances and compares good and poor fits visually.
Examples
Compares squared distances from data points to good- and poor-fitting regression lines.
What you can do after
Evaluate a linear regression fit by interpreting the sum of squared distances from points to its line.
How it connects
Connects linear regression error to absolute error and gradient descent.

Also explained in

Compare how 4 books explain squared loss →

Related concepts

This explainer was generated by Manning's knowledge graph from the text of Grokking Machine Learning. The section links point to the parts of the book it draws on.

