Survival probability is the chance that a loan remains current—has not defaulted—at a given time. A Kaplan–Meier curve starts at 1.0 and steps downward when defaults occur; a value near 0.90 at month 12 indicates about 10% defaulted. section 4.2.2
Figure 4.3 Kaplan–Meier survival curve for a synthetic loan portfolio. Each downward step in the curve reflects a default event. By month 12, about 10% of the loans have defaulted, consistent with our simulated parameters. Survival analysis enables granular, time-aware risk modeling by tracking each account independently rather than in aggregate.
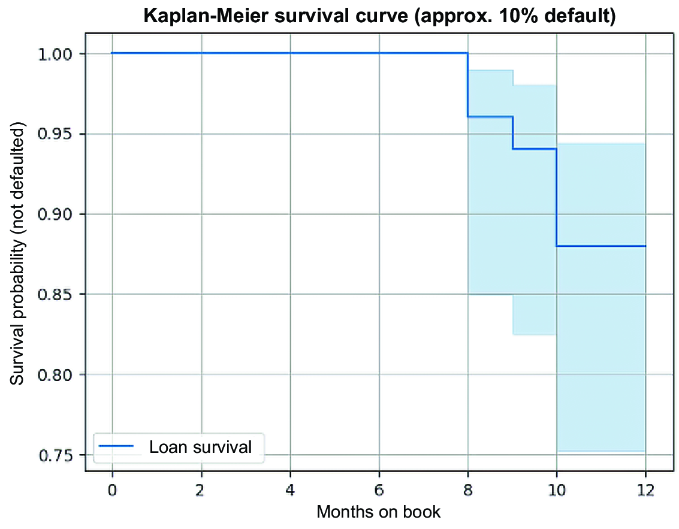
The curve shows how each default reduces the estimated share of loans still current over time. section 4.2.2
