Throughput retention measures sustained performance as a percentage of initial performance: last-30-second throughput divided by first-30-second throughput, multiplied by 100. It lets vision, audio, and language-model workloads be compared despite using different throughput units. section 11.1.2
A result below 100% indicates throughput fell during the measurement; a result above 100% can reflect a workload that warms up as clocks rise. Cold-start tests can miss thermal throttling. Measurements use five-minute windows after a 60-second thermal rest; continuously high-utilization workloads may need longer windows. section 11.1.2
Comparing device behavior
In the reported measurements, M3 vision over 60 seconds loses 35.6% of throughput, while M3 audio over 300 seconds gains 54.1%. Pixel results across modalities stay within 1.3 percentage points of 100%. section 11.1.2
Figure 11.2 Thermal retention across modalities and devices. Bar height is 100 × last_30s / first_30s of sustained throughput; 100% (dashed line) is the no-throttle baseline. Bar hatches encodes modality (vision plain, audio dotted, LLM cross-hatch). Annotations report retention percentage and first → last absolute throughput in the modality's native unit. The M3 vision 60 s bar loses 35.6%; the M3 audio 300 s bar shows a 54.1% gain; the Pixel bars hold within 1.3 percentage points of 100%.
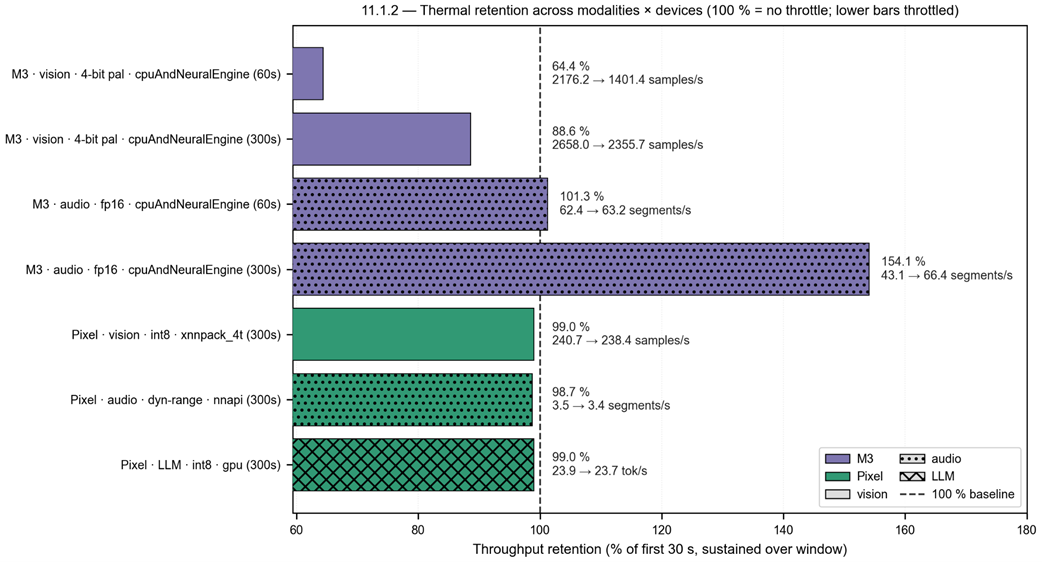
The chart normalizes throughput to a 100% no-throttle baseline, making thermal behavior comparable across modalities and devices. section 11.1.2
