Test-retest reliability measures whether the same individuals produce similar results when assessed repeatedly over time, assuming the measured concept has not changed. Reliable measures help stakeholders trust metrics and conclusions drawn from them. section 6.3.1
Assess test-retest reliability by following a repeat-measurement workflow:
- Collect or select the initial dataset for the measure. section 6.3.1
- Choose a time interval that fits the construct being measured and available resources. section 6.3.1
- Collect one or more subsequent datasets while retaining the same individuals or users. section 6.3.1
- Structure the data, often in wide format, with one row per person and one column per measurement period. section 6.3.1
- Compare scores across time intervals using Pearson’s or Spearman’s correlation; stronger correlations indicate greater consistency. section 6.3.1
Stable clinical or product measures
A person completing a depression scale should provide similar responses over time if symptoms remain stable. Likewise, a software user’s NPS scores should remain similar if the service has not substantially changed. section 6.3.1
Use test-retest reliability especially for business metrics and forecasting models intended to track change over time. Interpret the comparison only when the underlying concept or service is reasonably stable; otherwise, changed scores may reflect real change rather than measurement inconsistency. section 6.3.1
Figure 6.12 Test-retest reliability correlations are expected to be quite high across time periods (e.g., T1, T2, T3), often with an r value above 0.7.
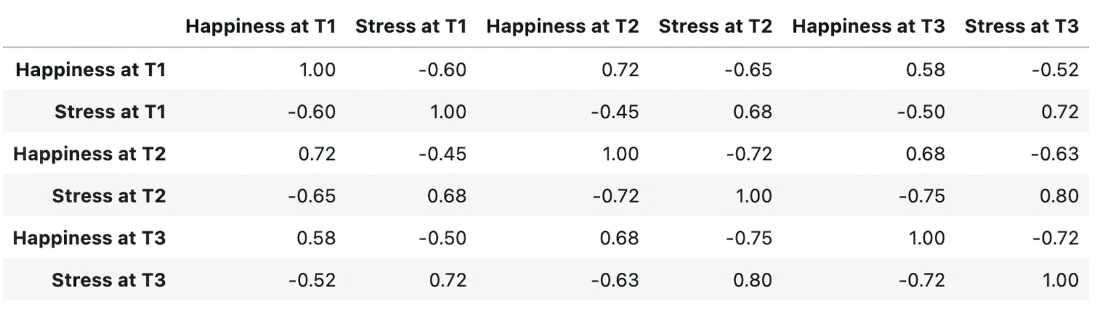
The figure visualizes expected high correlations among repeated measurements at T1, T2, and T3, often with r above 0.7. section 6.3.1
