A data story is a documented account of where a data resource came from, what it contains, how it has been assembled, what may be wrong with it, and how it is intended to support an ML project. Start it during sprint 0, before the modelling team has data access. Its job is to turn an uncertain operating domain into a working account of the data the team expects to use. section 4.5
Treat the data story as a pre-project investigation:
- Meet data architects and system users to identify the systems and people that can explain the data. section 4.9
- Trace source systems into the resources available for modelling. Record relevant tables, fields, scale, and any aggregation or normalization needed to make records useful. section 4.9
- Flag gaps and uncertainties rather than assuming the data is already clean or assembled. Keep ethical and legal use in view alongside technical availability. section 4.5
- Use the story to plan a sprint 1 data survey of resources and access. Follow that with exploratory data analysis to establish what is actually in the datasets. section 4.5
Bike Shop data story
A warehouse combines three regional operational databases. Meetings identify about 40 million rows and three potentially useful warehouse tables: transactions, product hierarchy/SKU, and currency. A country field provides geographic context even though records are not marked with their originating database. The hierarchy and currency tables are needed to aggregate and normalize transactions for predictions. These findings give the team specific resources and assumptions to check in its data survey. section 4.9
Figure 4.3 Three operational databases used to create the tables in opdis2
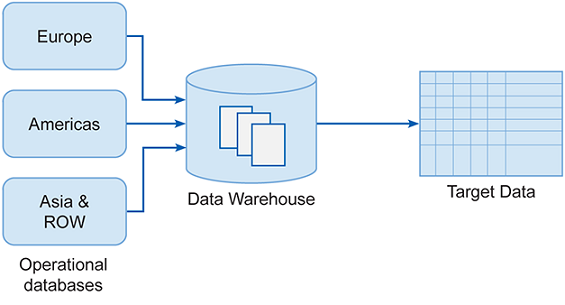
The source-to-warehouse flow helps trace the three operational databases behind the proposed modelling tables. section 4.9
Keep the data story as a named documentation deliverable, available for team discussion and stakeholder review. It is an early account, not a substitute for the later data survey or EDA report. section 4.3.5 section 4.5
