Use of color is a WCAG Level A requirement: never rely on color alone to convey information. Color may still help, but pair it with another visible cue. section 4.4.2
Practical ways to make color carry supporting evidence rather than the whole message:
- Pair color with position or form, such as shape or length. section 4.4.2
- Add a label when the meaning might still be ambiguous. section 4.4.2
- Treat movement cautiously, since it can confuse or overwhelm users. section 4.4.2
- If a preferred palette fails the guideline, offer a toggle to an accessible palette. section 4.4.2
Figure 4.34 On the left, the blue bars have no border, so the contrast is calculated between the blue and the light gray as 1.93:1, which is too low to pass WCAG’s AA level of 3:1. However, if you add a dark-gray border, the contrast is then calculated using the border against the background, which shows up better than just the plain blue bars. The contrast between the darker gray border and the lighter gray background is a whopping 8.7:1, beating out the AA level by almost a factor of two.
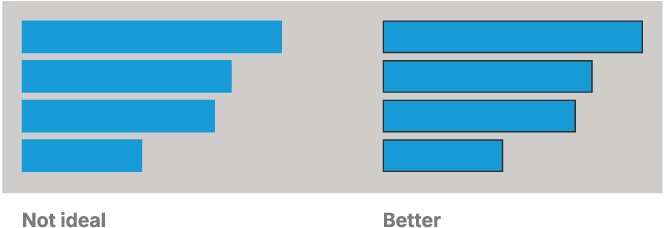
A dark border can provide the additional non-color cue that plain blue bars lack, while also improving their contrast against the background. section 4.4.2
