A validation curve plots model performance as a selected hyperparameter or model dimension changes. It reveals how complexity affects generalization, helping distinguish underfitting from overfitting. section 4.4.3 section 4.4.1
Read a validation curve by looking for these patterns:
- Low complexity can produce high bias and underfitting, with high training error. section 4.4.3
- Excessive complexity can produce high variance, strong training performance, and poorer generalization. section 4.4.3
- Choose the region where test or validation error is lowest and the complexity–generalization trade-off is acceptable. section 4.4.3
- Construct curves by evaluating a scoring metric across the chosen dimension with standard k-fold cross-validation. section 4.4.1
SVR solubility model
For an SVR estimator, vary L2 regularization, polynomial feature degree, or epsilon-tube width. Smaller alpha and higher polynomial degree increase complexity; the curves expose when training gains become a widening train–test gap. section 4.4.3
Figure 4.20 Validation curves for SVR and preprocessing hyperparameters.
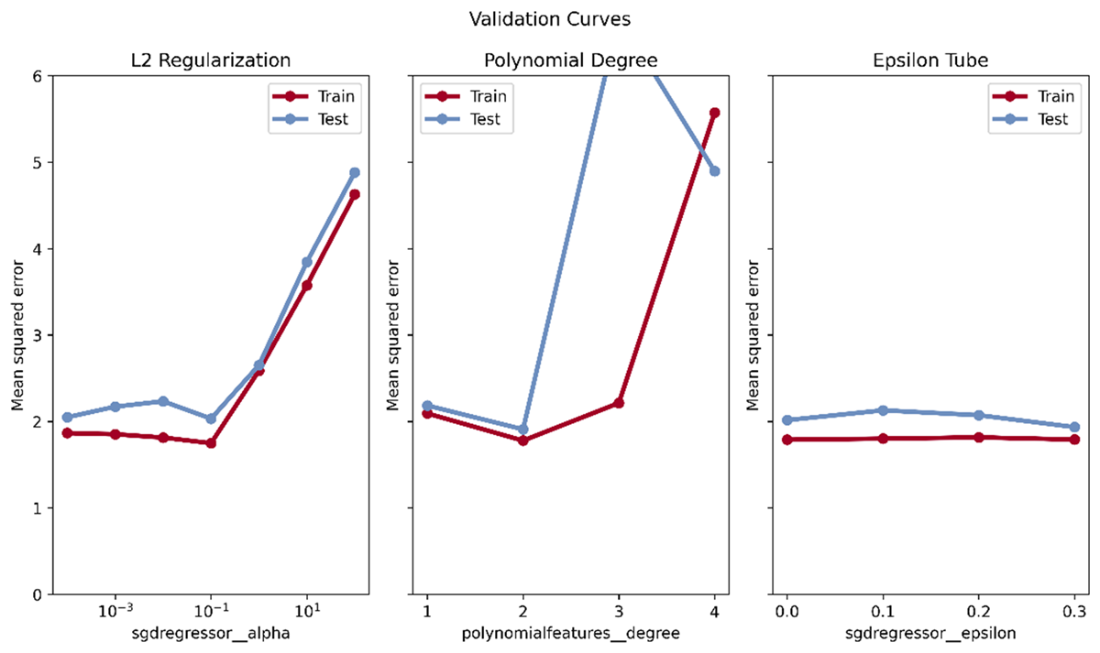
Inspect the SVR validation curves for regularization, polynomial degree, and epsilon-tube width. section 4.4.3
Figure 4.21 How different errors (train, validation, generalization) and bias and variance change as a function of the number of data points (left, learning curve) or the model complexity (right, validation curve).
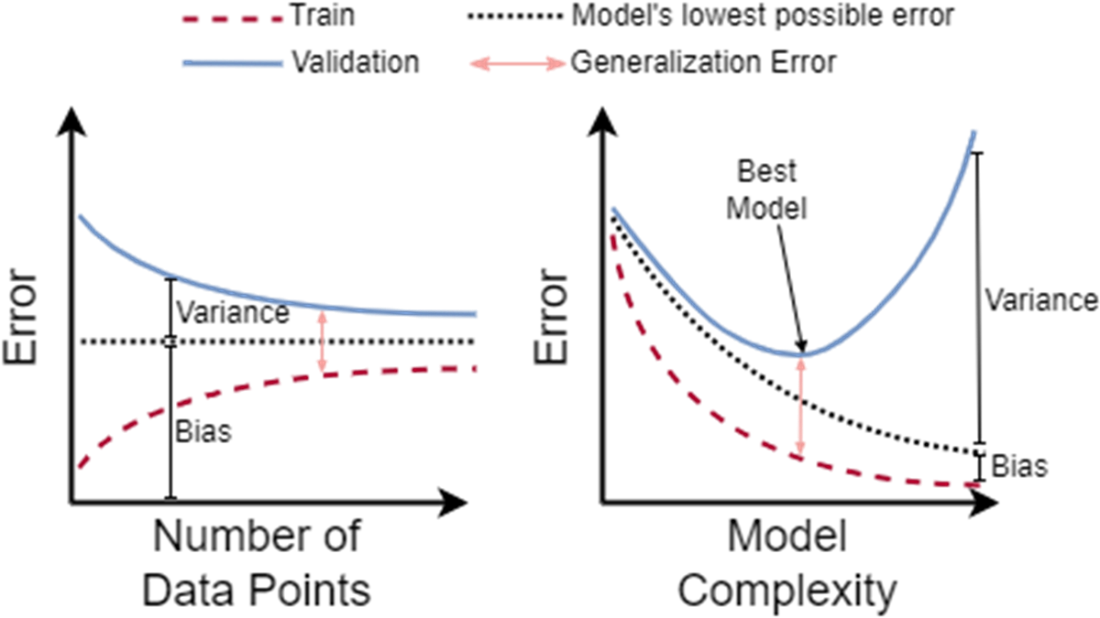
Compare how validation curves relate model complexity to bias, variance, and different error measures. section 4.4.3
