Volatility mean reversion describes volatility spikes that eventually move back toward pre-crisis levels. The 2008 VIX episode illustrates implied volatility falling from 80% to 21% over the following year. section 3.2.2
ARCH and GARCH models capture volatility clustering and mean reversion, allowing volatility forecasts after unusually turbulent periods. section 3.2.2
A practical GARCH forecasting workflow:
- Compute AAPL percentage returns, multiply them by 100 for optimizer convergence, and remove the initial missing value. section 3.2.2
- Fit a basic GARCH model, forecast 63 trading days, sum the one-day variances, annualize by 252 divided by the horizon, and take the square root. section 3.2.2
- Interpret the illustrative output as a forecast declining from approximately 9.87 to 9.22 in residual variance, producing 48.10% annualized volatility. section 3.2.2
Figure 3.5 VIX implied volatility around the financial crisis of 2008
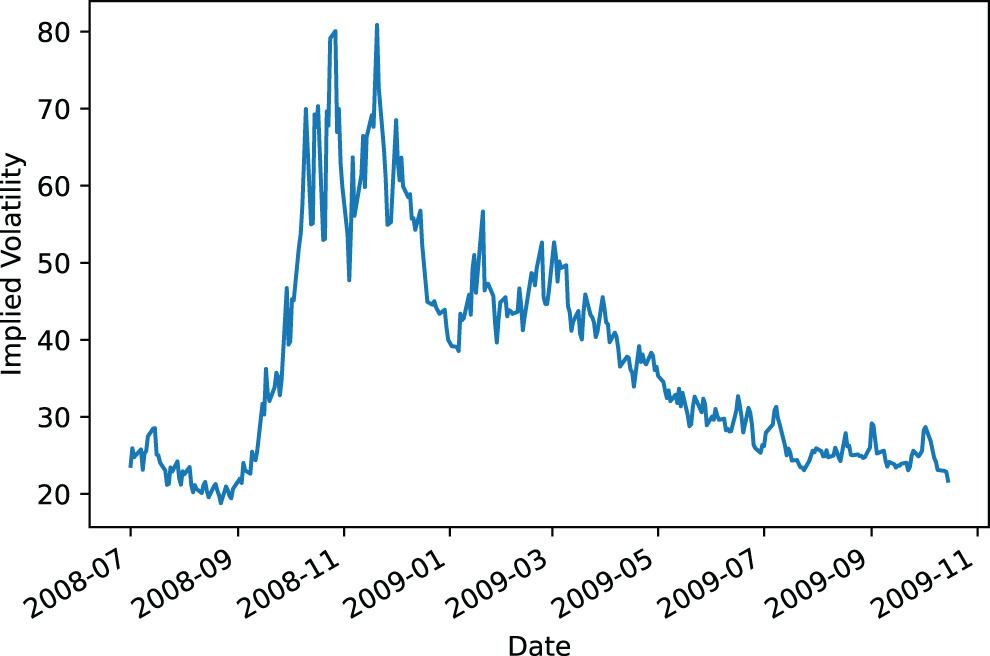
View the VIX crisis-period figure showing the temporary volatility spike and subsequent reversion. section 3.2.2
