liveBook · Manning

Waterfall visualization

As explained in Cloud Observability in Action

A waterfall visualization is a time-aligned display showing the durations and ordering of activities or service executions.

A waterfall visualization aligns service executions along a time axis, showing their ordering, duration, nesting, and contribution to an end-to-end request. section 8.1.1 section 2.5

Tracing a checkout request

A catalog request produces a trace whose root span is checkout. Child spans show billing, a third-party payment provider, shipping, and inventory activity. Visual inspection reveals that billing consumes about half the checkout time, with most of that phase spent in the external payment call. section 8.1.1
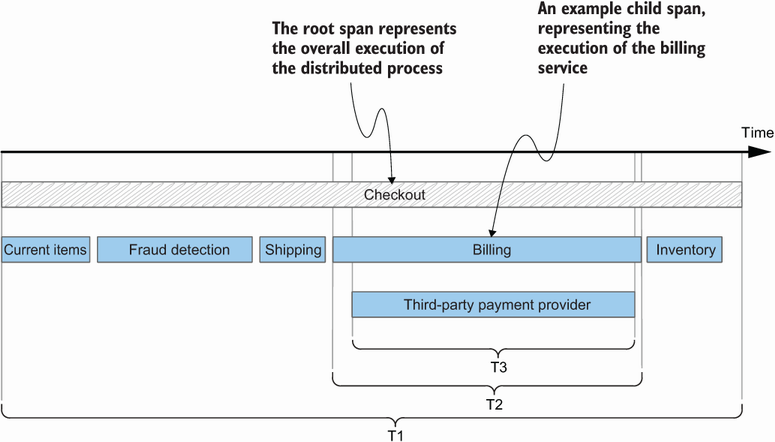
Figure 8.3 A single request path in the app, as a temporal (waterfall) visualization

Use the temporal request-path diagram to compare service invocations by start time, duration, nesting, and completion order. section 8.1.1

How Cloud Observability in Action covers it

How deep it goes
Defines traces and spans, demonstrates latency inspection, and defers deeper distributed-tracing details.
Examples
Uses a microservices checkout path, billing and payment spans, and browser developer tools as parallel examples.
What you can do after
Diagnose latency by locating slow services, nested calls, and expensive external operations within a request trace.
How it connects
Connects distributed tracing, traces, spans, service maps, dependency graphs, and request propagation.

Related concepts

This explainer was generated by Manning's knowledge graph from the text of Cloud Observability in Action. The section links point to the parts of the book it draws on.