A wavelength is the spatial period of a wave: the distance between matching points in successive cycles. For light, wavelength is tied to energy, and only some wavelengths are visible to human eyes. Those visible wavelengths appear as colors. section 4.1.1
Different wavelengths interact differently with matter and with the eye’s cone cells. A prism separates white sunlight because its component wavelengths bend at different angles, revealing the visible spectrum from red through violet. section 4.1.1
A rainbow in a prism
Sunlight contains many wavelengths. When a water droplet or prism bends them by different amounts, the colors spread apart into a rainbow; when combined, the colors produce white light. section 4.1.1
Figure 4.1 A ray of white sunlight enters a prism and exits as a rainbow because the prism causes the different wavelengths in the white light to separate. (Prism-rainbow.svg: Suidrootderivative work. Sceptre, CC BY-SA 3.0, via Wikimedia Commons. Labels added by me)
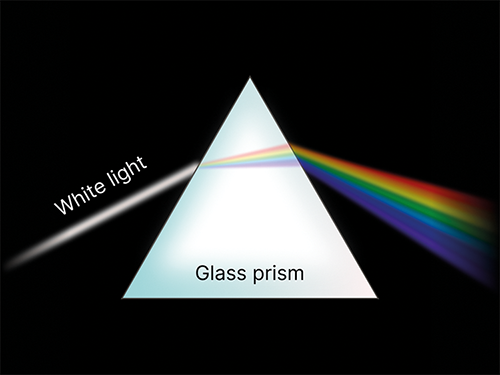
Trace how white sunlight enters a prism and separates into colors according to wavelength. section 4.1.1
