A z-score table is a tabular reference for converting standardized values into cumulative probabilities under the standard normal distribution. Standardize a raw value with z = (x − μ) / σ; positive values lie above the mean, and negative values lie below it. section 13.4 section 3.1.1
Use the table as follows:
- Calculate the z-score from the value, distribution mean, and standard deviation. section 3.1.1
- Match the first two z-score digits in the left column with the remaining digits across the top row. section 13.4
- Interpret the intersecting entry as the cumulative probability, or area associated with the standardized value. section 13.4 section 3.1.1
- Treat the result as an approximation because tables round values; scipy.stats.norm.cdf() computes the probability with floating-point precision. section 13.4
Project completion probability
For a 30-week due date, a mean duration of 29 weeks, and a standard deviation of 1.41 weeks, z = (30 − 29) / 1.41 = 0.709. Locating 0.7 and 0.09 in the table gives 0.7852, or a 78.52% chance of completing within the deadline. scipy.stats.norm.cdf(0.709) gives 76.09%; the difference reflects table rounding and precision. section 13.4
Figure 13.4 The top of a typical z-score table. The probability is found where the integer and remaining fractional parts of the value intersect.
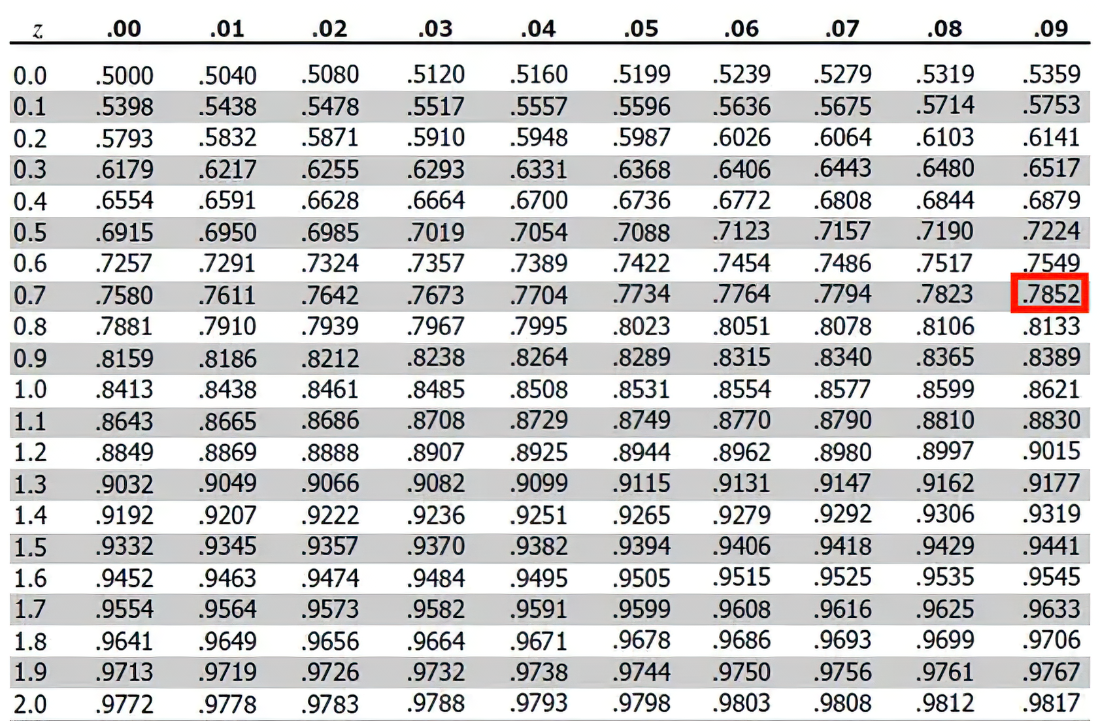
Use the table figure to see how the integer and fractional parts of a z-score identify the probability entry. section 13.4
